The Delta read: what it follows, and what it does not show
NIFTY sessions in 2025 and 2026
v1 (21 Oct 2026) compared each read with the market's move so far in the session. v2 rewrites the study in plain words and adds a test of the next hour, on 1,845 readings across 369 sessions in 2025 and 2026.
The question
When the Delta read leans long or short, what has NIFTY done so far that day, and what does NIFTY do in the next hour? A read of open interest and premium changes that only repeats the market's move adds nothing, and one that keeps fighting it is hard to trust.
In plain words
The Delta read adds up the new positions in the option chain. For each strike it takes the change in open interest and multiplies it by the option's delta, which is how far the option's price moves for each point the index moves.
Whether a new position is long or short is inferred. Nobody can see who bought or sold. The read looks at how open interest and the option's price changed together: more open interest with a higher price reads as new long positions, more open interest with a lower price as new short positions. The price part is first adjusted for the index's own move, for time passing and for the chain-wide change in implied volatility. A new long call adds long delta; a new long put adds short delta, because a put's delta is negative.
Every contract has a holder on one side and a writer on the other. So the read does not count who is on which side of the whole market. It counts the part of the new open interest that looks, from its price, as if it was started on one side.
The result is a long share: the part of the classified delta that leans long. Above one half the read leans long, below one half it leans short. It describes positions that were added. It says nothing about where the index goes next, which is what the tests below look at.
What we found
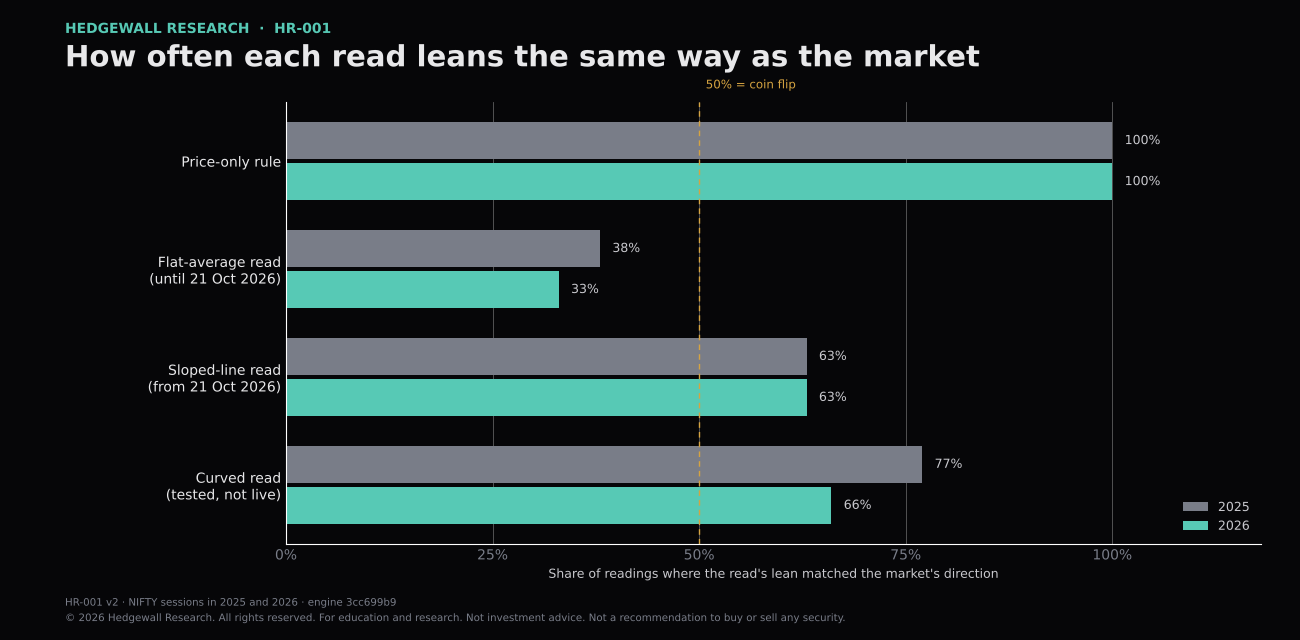
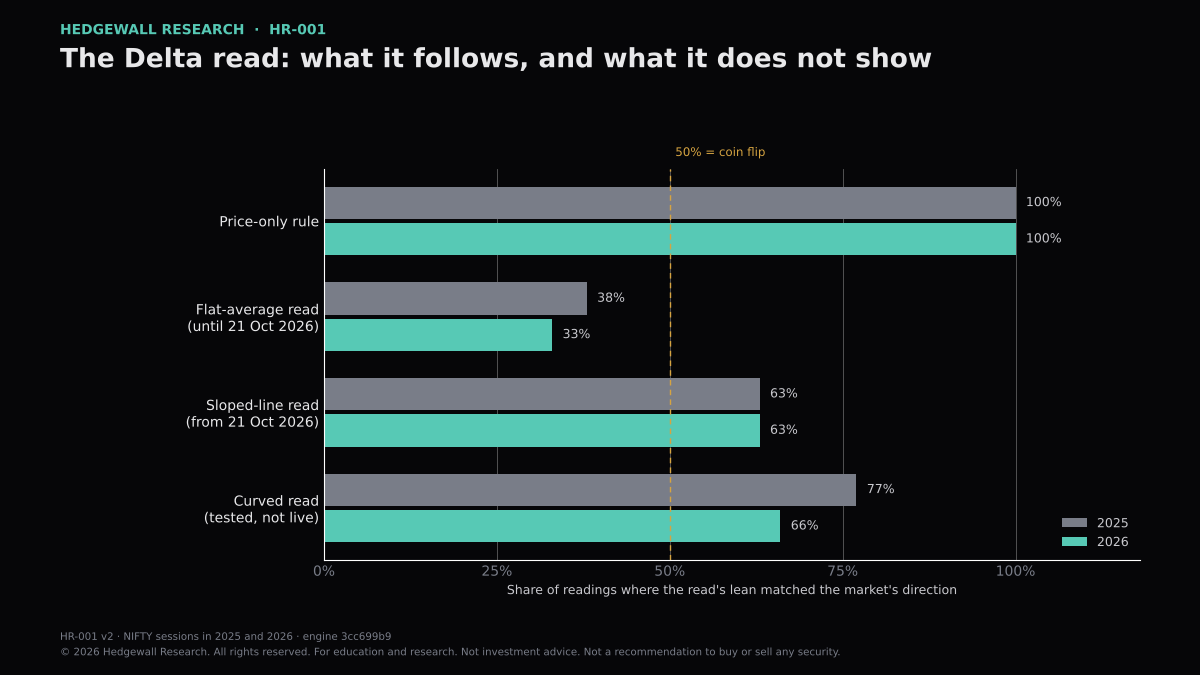
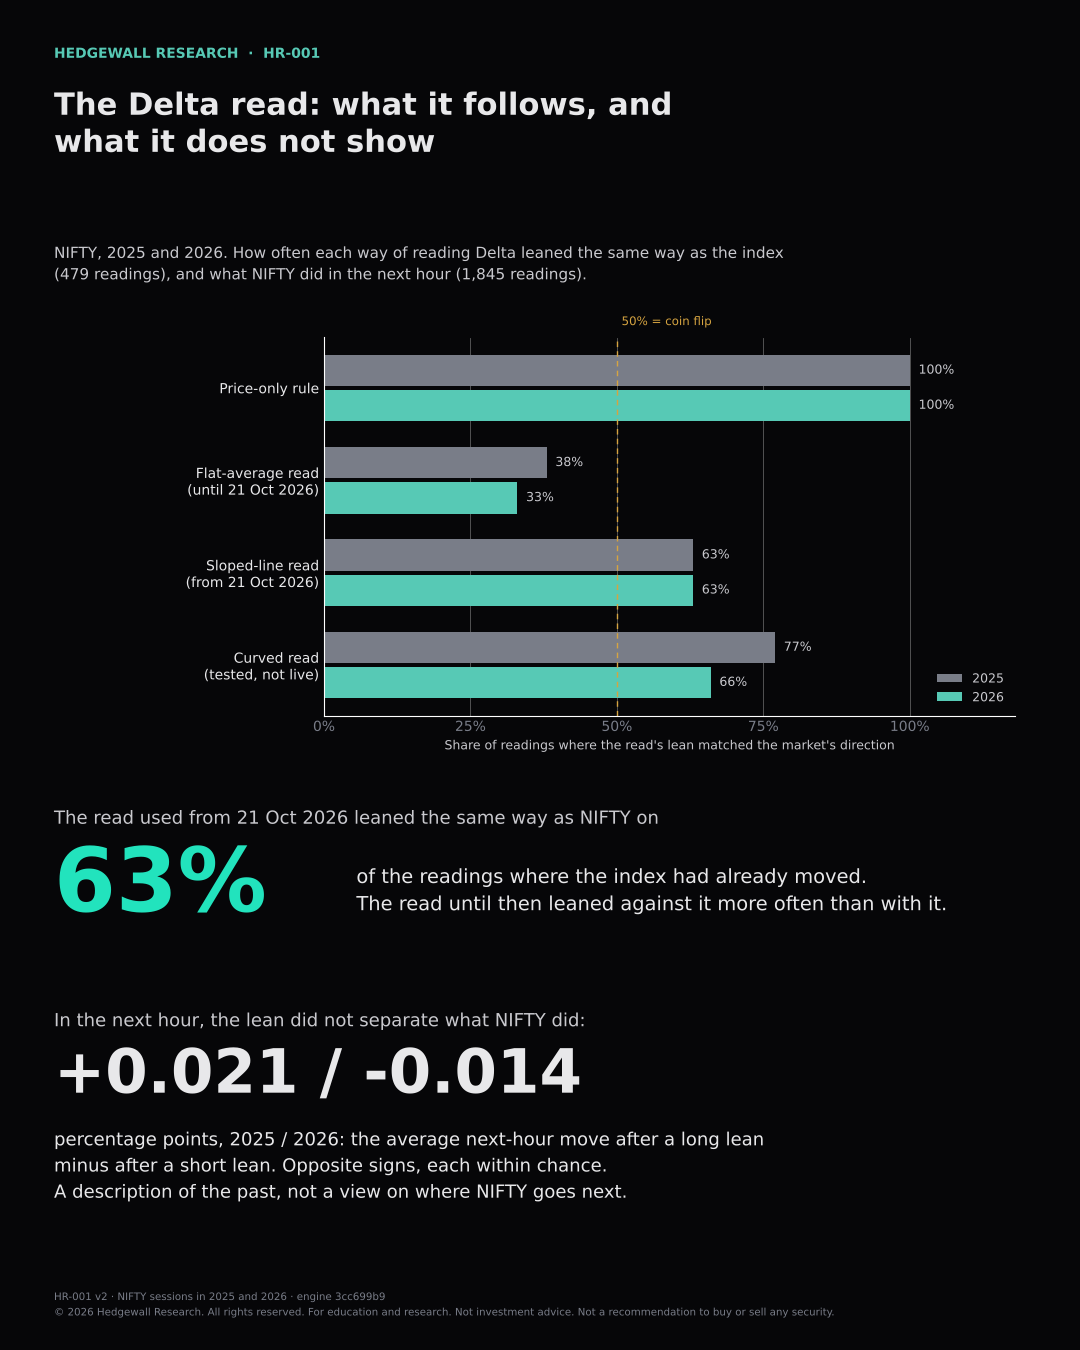
Across 479 readings where NIFTY had moved more than 0.3% since the open, the read that compared every strike with one chain-wide average agreed with the market's direction on 35% of them. It leaned against the market more often than with it.
The read used from 21 Oct 2026 compares each strike with a sloped line across strikes. It agreed on 63% in both years and read extreme on only 1% to 3% of readings. A price-only rule read extreme on 68% to 71%.
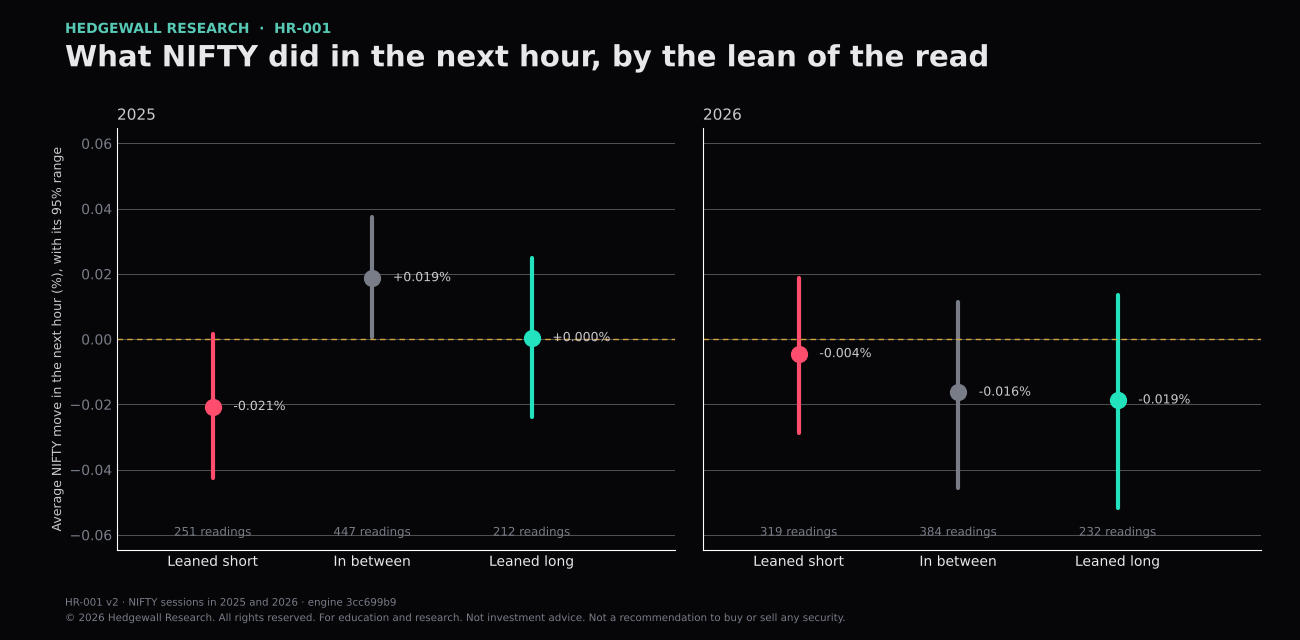
In the next hour, the lean of the read did not separate what NIFTY did. NIFTY rose in 49% of the hours after a long lean and 39% after a short lean in 2025, and in 47% and 45% in 2026. The gap in the average next-hour move, long lean minus short lean, was +0.021 percentage points in 2025 and -0.014 in 2026: opposite signs, and each as large as shuffling the readings across days gives 23% and 48% of the time.
The numbers
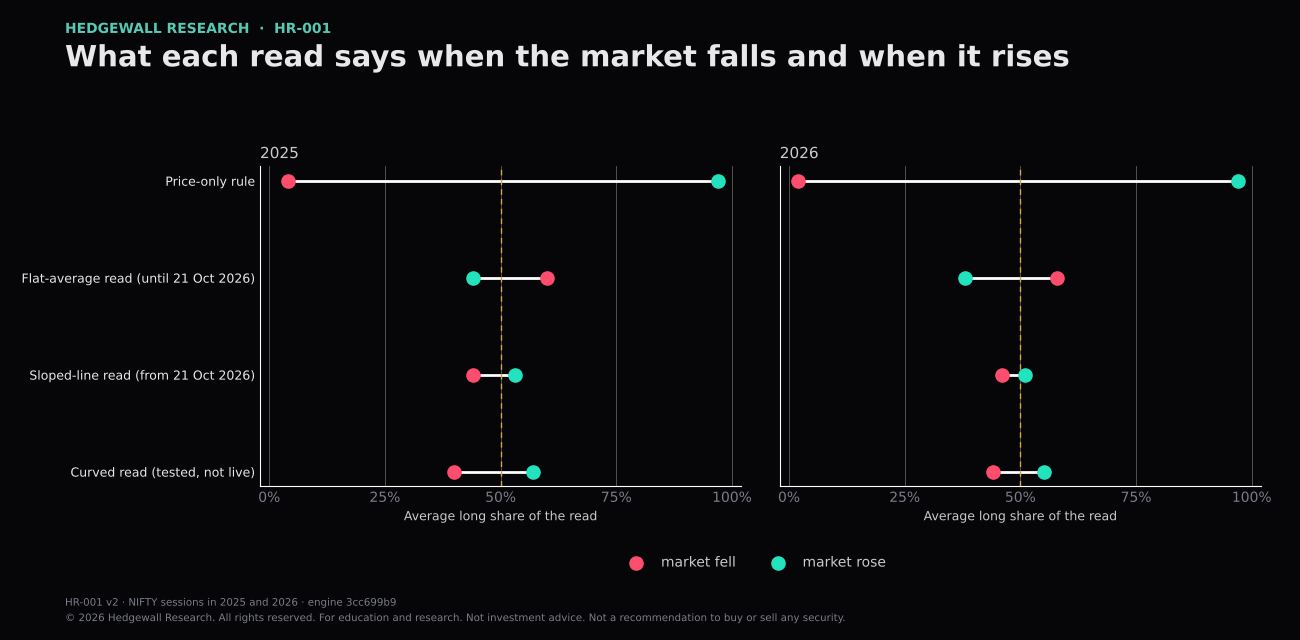
| Read | Agrees with the market 2025 / 2026 | Extreme readings 2025 / 2026 | Average long share, market fell / rose, 2026 |
|---|---|---|---|
| Price-only rule | 100% / 100% | 68% / 71% | 0.02 / 0.97 |
| Flat-average read (until 21 Oct 2026) | 38% / 33% | 1% / 3% | 0.58 / 0.38 |
| Sloped-line read (from 21 Oct 2026) | 63% / 63% | 1% / 3% | 0.46 / 0.51 |
| Curved read (tested, not live) | 77% / 66% | 4% / 6% | 0.44 / 0.55 |
Agrees with the market: the read leaned long (a long share above 50%) when NIFTY was up since the open, or leaned short when it was down. Counted on readings where NIFTY had moved more than 0.3% since the open: 228 in 2025, 251 in 2026. Extreme readings: a long share above 90% or below 10%, counted over all readings. Average long share: the mean long share of the read over those 2026 readings, split by whether NIFTY was down or up since the open. The highlighted row is the Sloped-line read (from 21 Oct 2026).
The next hour
| Lean of the read | Readings | Average next-hour move | NIFTY rose in | Average move to 15:25 | Range of the next-hour average over days |
|---|---|---|---|---|---|
| 2025 Leaned short | 251 | -0.021% | 39% | -0.040% | -0.043 to +0.002 |
| 2025 In between | 447 | +0.019% | 54% | +0.021% | +0.001 to +0.037 |
| 2025 Leaned long | 212 | +0.000% | 49% | -0.014% | -0.024 to +0.025 |
| 2026 Leaned short | 319 | -0.004% | 45% | -0.038% | -0.029 to +0.019 |
| 2026 In between | 384 | -0.016% | 48% | -0.038% | -0.045 to +0.011 |
| 2026 Leaned long | 232 | -0.019% | 47% | -0.053% | -0.052 to +0.014 |
- 2025: long lean minus short lean, +0.021 percentage points (range over days -0.011 to +0.054); shuffled readings give a gap this large 23% of the time.
- 2026: long lean minus short lean, -0.014 percentage points (range over days -0.053 to +0.024); shuffled readings give a gap this large 48% of the time.
Each reading is the sloped-line read at 10:30, 11:30, 12:30, 13:30 and 14:30 IST. Leaned short means a long share below 40%, leaned long above 60%, in between otherwise. The next hour is NIFTY's change from the reading to one hour later, cut at 15:25 IST, in percent. The range is the 95% range of the average when whole days are resampled 2,000 times. The gap is the average after a long lean minus the average after a short lean, in percentage points. Chance: the share of runs, with the read's values shuffled across days at the same clock time, that give a gap at least this large either way.
The charts
What this does not show
- It describes how a read behaves. It does not show who initiated any trade; nobody can see that from open interest and premium changes.
- Agreement with the market is a sanity check, not a score. 100% would mean the read only repeats the market (the price-only rule). 0% would mean it always opposes it.
- NIFTY only. Other indices and stocks are not tested here.
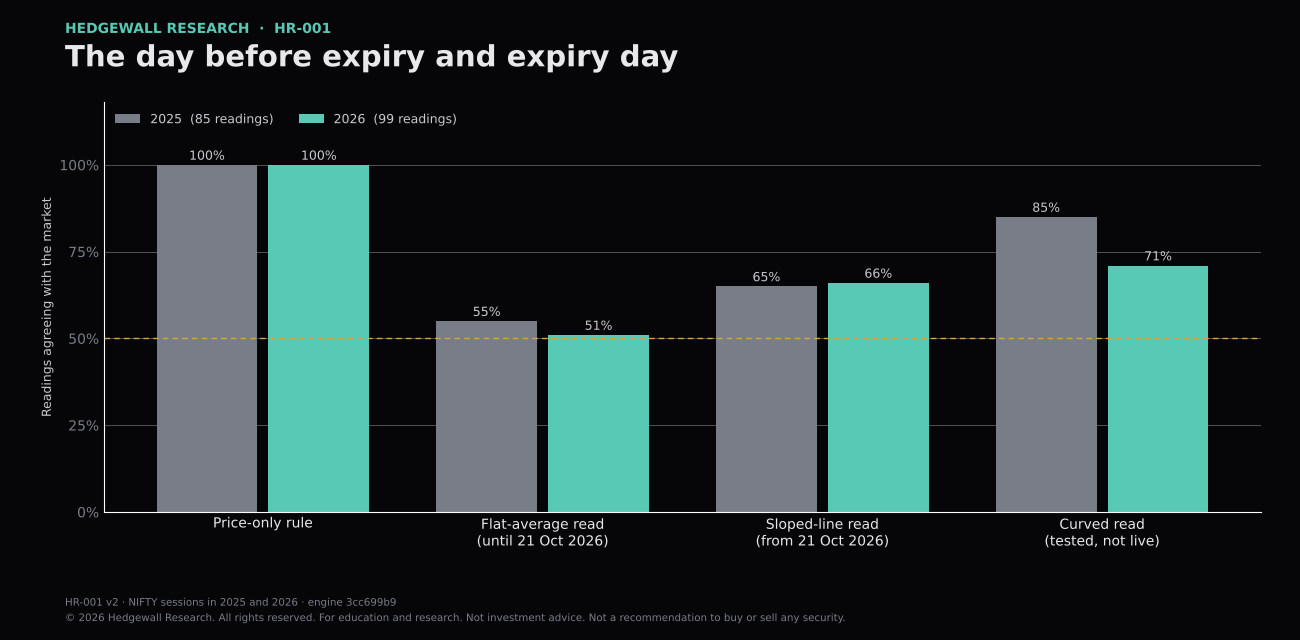
- Two sets of readings. The agreement table uses three a session (11:00, 13:00, 15:00 IST), each against a 09:16 reference. The next-hour test uses five a session (10:30 to 14:30 IST). Readings on the same day are not independent of each other.
- The next-hour test covers one horizon, 60 minutes, cut at 15:25 IST. Other horizons are not tested.
- With 369 sessions, a difference smaller than about 0.04 percentage points in the average next-hour move cannot be told apart from chance here. The lean of the read may carry something at a size this test cannot see.
- Extreme readings (a long share above 90% or below 10%) were too rare to test on their own: 14 in 2025 and 31 in 2026.
- It says nothing about how to trade, and nothing here shows that any lean could be used to. It describes the past only.
Method
- Data: exchange tick data for NIFTY index options and the index level, 2025 and 2026. Front expiry; strikes within 5% of the index level.
- Each reading runs the engine's own Delta positioning code, not a copy: version d3c043d0 for the agreement table and version 3cc699b9 for the next-hour test. The Delta read's code is unchanged between the two. The agreement table compares four reads: price-only, flat-average, sloped-line and curved. The next-hour test uses the sloped-line read, the one used from 21 Oct 2026.
- Market direction, for the agreement table, is the change in the index level from 09:16:30 to the reading time; only readings where it moved more than 0.3% are scored. Long share is the share of classified delta (crore of delta-notional) that leans long.
- Next-hour test: readings at 10:30, 11:30, 12:30, 13:30 and 14:30 IST on each session; the next hour runs to 15:25 IST at the latest. Ranges resample whole days 2,000 times, because readings on one day are not independent. The chance figure shuffles the read's values across days at the same clock time. The adjusted figure fits the next-hour move on the move since the open and on the read, with errors grouped by day.
- The scripts that produce these figures are in this study's replay folder; the tick data is a licensed provider's and is not published.
Downloads
Cite as
Hedgewall Research, HR-001, v2, 22 Oct 2026.
Link to hedgewall.in/research/hr-001/. Quoting a short passage with a clear credit is permitted; see the terms of use.