VOLEX: where the day's vega trades, and what that does not tell you
NIFTY, 439 trading sessions, 1 Jan 2025 to 8 Oct 2026
The question
VOLEX counts how much volatility exposure the day's trading carried at each strike. Does it point to different strikes than plain volume does, when in the day does that trading happen, and does it say anything about where NIFTY closes or how wide the day is?
In plain words
Volume counts contracts. A far-away contract that costs a few rupees counts the same as one near the index, but the two react very differently when implied volatility moves. Vega is how much an option's price changes for a one-point change in implied volatility. It is large near the index and tiny far away.
VOLEX multiplies each strike's traded volume by its vega, for calls and puts, and adds the result up in rupees crore per one point of implied volatility. It describes how much volatility exposure changed hands at a strike. It carries no side: nobody can see who was long or short, and VOLEX does not say.
This study asks six plain questions, written down before any number was run. Do VOLEX and plain volume point to the same strikes? When in the day does the trading happen? On expiry days, how close does the close come to the busiest strike? Do strikes where heavy trading did not stick behave differently? Does early trading go with a wide day? Do days with more put trading go with a rise in implied volatility?
What we found
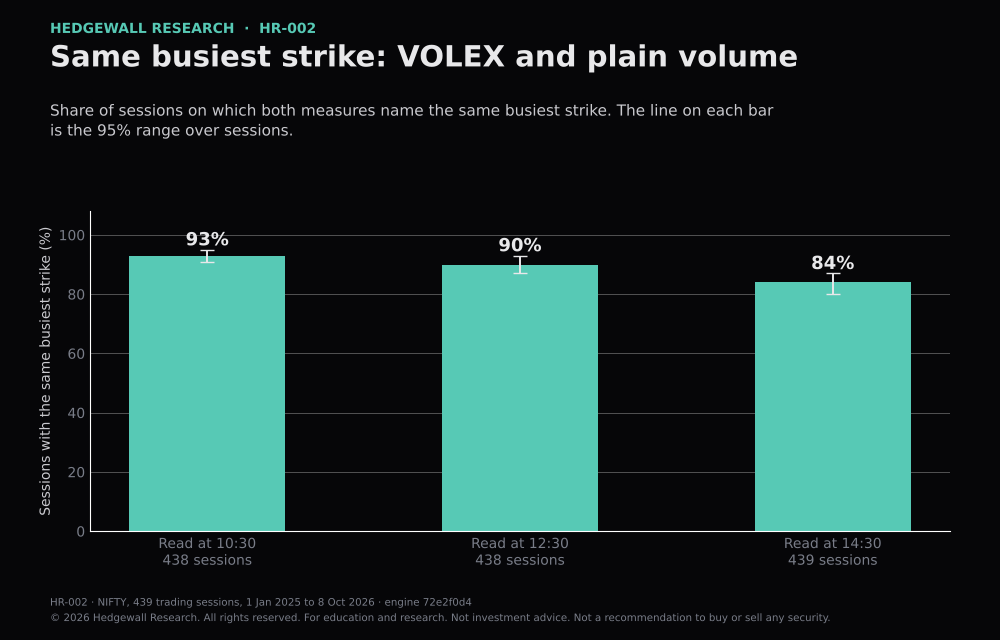
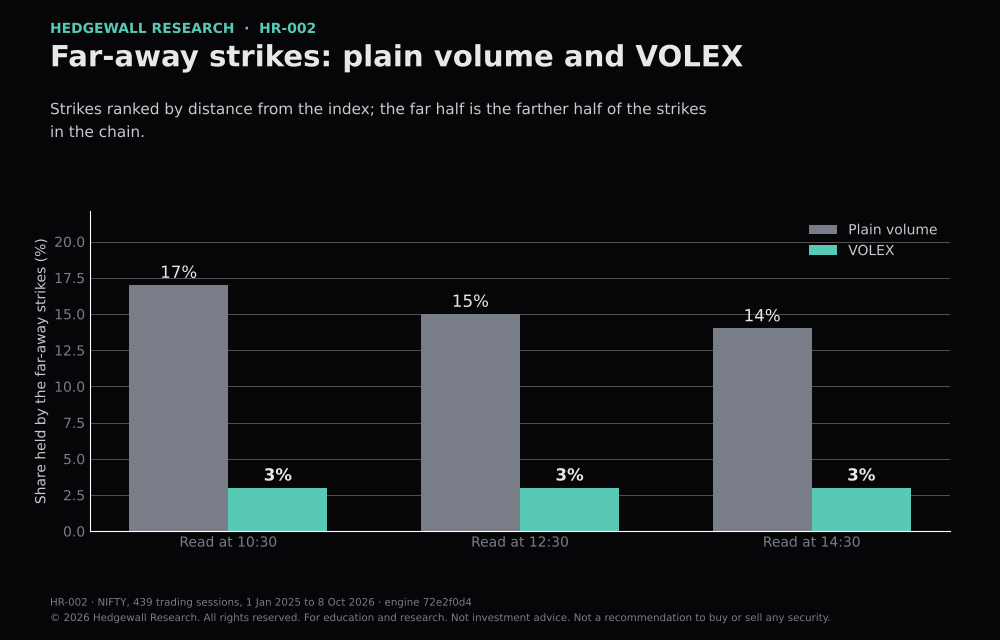
VOLEX and plain volume pointed to the same busiest strike on 93% of sessions at 10:30, 90% at 12:30 and 84% at 14:30, and close to the same in both years. The top three strikes matched in full on 88%, 80% and 79%. The difference is at the far strikes: the far-away half of the strikes holds 17% of plain volume at 10:30, and 3% of VOLEX.
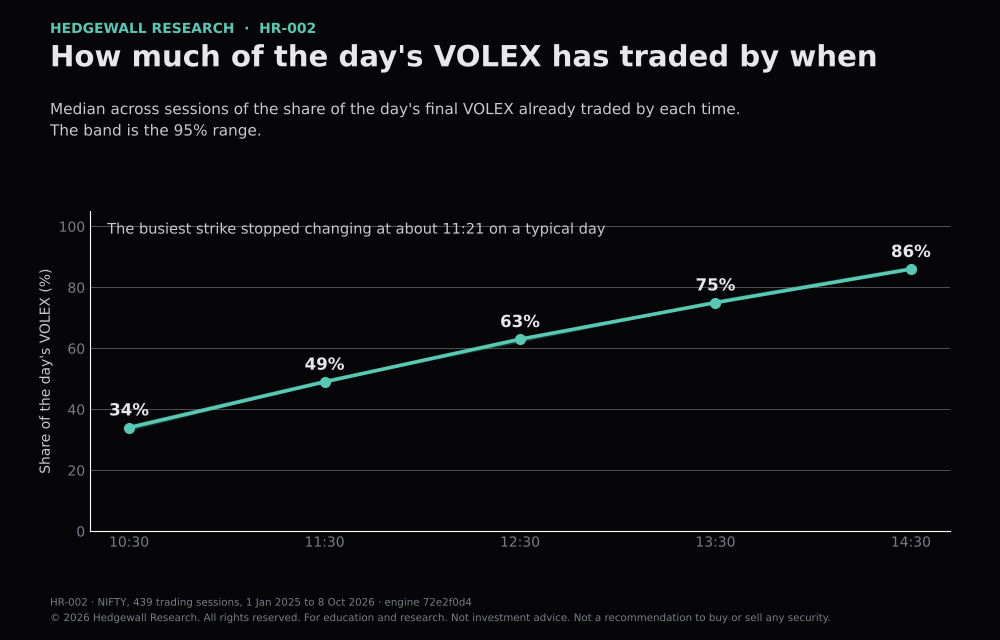
By 10:30, 34% of the day's final VOLEX has traded, 63% by 12:30 and 86% by 14:30. The busiest strike stopped changing at about 11:21 on a typical day (between 10:36 and 11:56). On expiry days the top three strikes hold 77% of the day's VOLEX at 14:30, against 42% to 49% on other days.
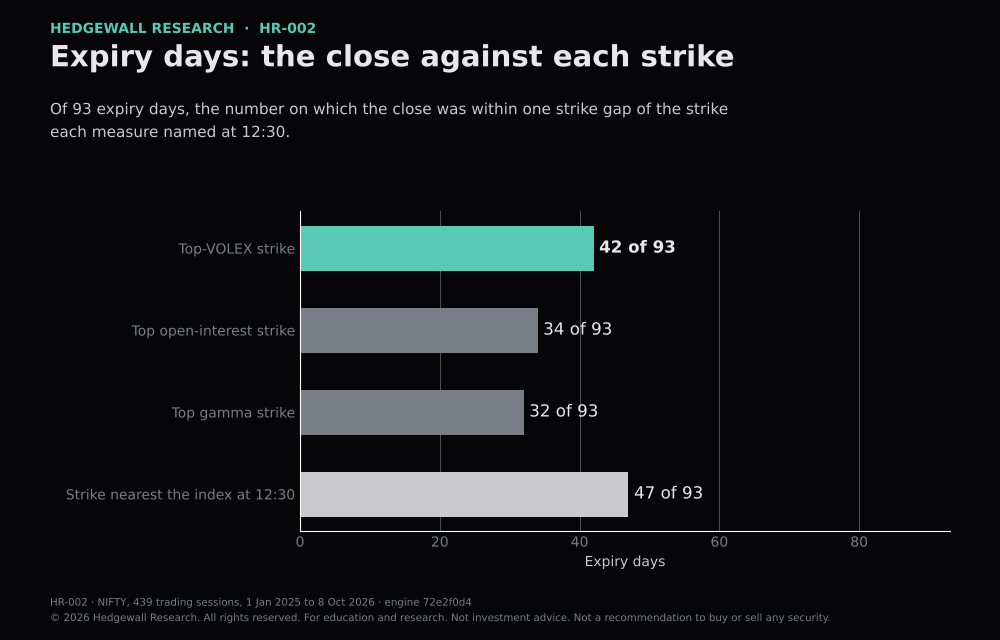
On the 93 expiry days, the close was within one strike gap of the top-VOLEX strike, read at 12:30, on 42 days, of the top open-interest strike on 34, of the top gamma strike on 32, and of the strike nearest the index at 12:30 on 47. VOLEX was closer than the open-interest strike on 11 days to 3 (a split this lopsided happens by chance 6% of the time) and closer than the gamma strike on 20 to 10 (10%). It was not closer than the strike nearest the index (5 to 10, 30%), and the years differ: within one gap on 28 of 53 days in 2025 and 14 of 40 in 2026, against 26 and 21 for the nearest strike.
VOLEX traded by 10:30 had no link to how wide the day turned out: the link was -0.02 (range -0.11 to +0.07) over 438 sessions, and near zero in both years. Days with a larger put share of VOLEX were days when implied volatility had risen more since the open (+0.14, +0.12 and +0.15 at the three times), but the link goes away once the index's own move since the open is taken out (-0.02, +0.04 and +0.07). What looked like a link was the index's own move.
One real day
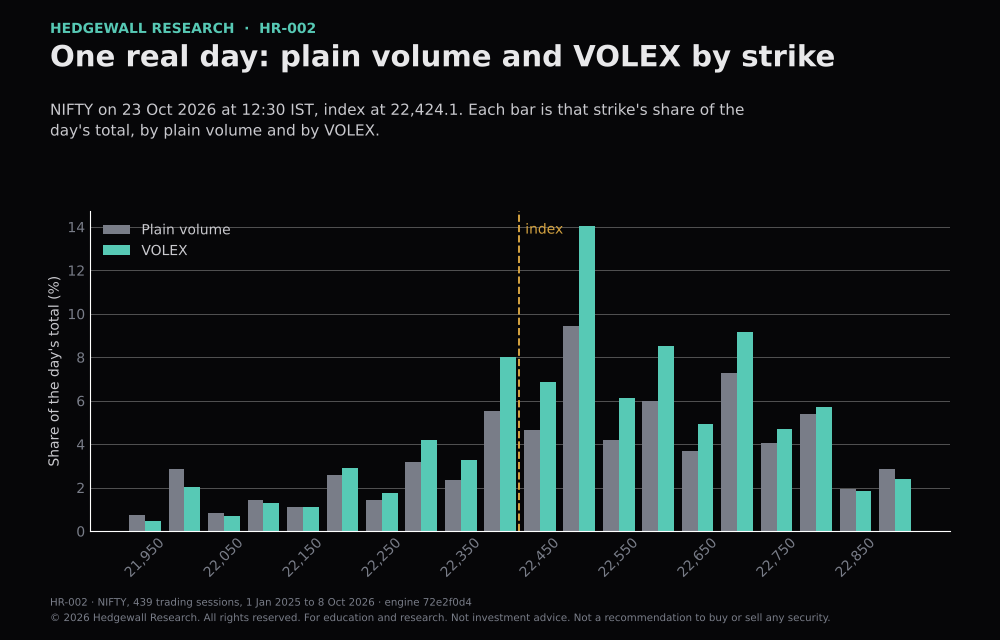
NIFTY on 23 Oct 2026 at 12:30 IST, index at 22,424.1, from Hedgewall's own stored tape. The five busiest strikes by plain volume were 22,500, 22,700, 22,600, 22,400, 22,800. By VOLEX they were 22,500, 22,700, 22,600, 22,400, 22,450. The far-away half of the strikes held 12.2% of the day's plain volume and 1.8% of its VOLEX.
The charts
What this does not show
- NIFTY only, checked every five minutes, over 439 sessions (249 in 2025 and 190 in 2026). 9 Oct 2026 has no index file and is left out.
- The volume level is approximate. The tick files carry the last traded quantity, not a day total, so the day's volume is their running sum. A row that repeated an old trade would be counted again. The questions use rankings, shares and links, which an even overcount does not change; an uneven one could.
- Only 93 days were expiry days. A difference of a few days out of that is small, and the two years differ.
- The strikes in the legs table come from the same sessions and sit next to each other, so they are not independent. That table has no ranges and is a note, not a finding.
- VOLEX has no side. Nothing here says who traded, or what an index does next. The 12:30 questions read a strike at 12:30 and only describe what followed.
- Effects smaller than the noise in 439 sessions cannot be seen, and a link close to zero does not rule out a small one.
Method
- Data: exchange tick data for NIFTY index options and the index level, NIFTY, 1 Jan 2025 to 8 Oct 2026. Front expiry; strikes within 5% of the index level. Only aggregate results are published; the tick data is a licensed provider's and is not.
- VOLEX is computed by the product's own function, compute_volex_by_strike in engine/flows.py, on a chain built as the product builds it: the same forward, the same implied volatility, the same vega as the gamma figures beside it. No formula in this study is new.
- A snapshot is taken every five minutes from 09:16:30 to 15:25. Ranges are 95% ranges from 2000 resamples of whole sessions, with a fixed seed. A link is a number from -1 to +1: whether days that rank high on one measure tend to rank high (+) or low (-) on the other. Zero is no link.
- Strike classes on the legs note use the OI by VOLEX pane's rule: a leg is large when it is at or above the median of the legs shown, on the change in open interest since 09:15 and on VOLEX. 'Traded, not kept' is heavy VOLEX with a small change in open interest; 'built on heavy volume' is heavy VOLEX with a large rise.
- Engine commit 72e2f0d4. The replay script is in replay/hw_volex_study.py; run it on the tick files to reproduce every figure.
Downloads
Cite as
Hedgewall Research, HR-002, v1, 25 Oct 2026.
Link to hedgewall.in/research/hr-002/. Quoting a short passage with a clear credit is permitted; see the terms of use.