Straddle breakevens: how often the index finishes outside them
NIFTY, 439 trading sessions, 1 Jan 2025 to 8 Oct 2026
The question
The Straddle tab prints two breakevens: the at-the-money strike plus and minus the straddle's price. Measured from the open, how often does the index finish outside them when the options expire, and does that change with how far away expiry is, or with the gamma regime at the open?
In plain words
A straddle is a call and a put at the same strike. Its price is what the two cost together. Add that price to the strike, and take it away from the strike, and you get two index levels: the breakevens. If the index finishes between them at expiry, the move was smaller than the straddle's price. Outside them, it was larger.
This study takes the opening reading of each session and the breakevens exactly as the Straddle tab computes them, then looks at where the index was at the close of the expiry session. It counts how often the close was outside the breakevens. It counts closes against printed levels and says nothing about any position or what one earned.
As a yardstick only: if a straddle were priced fairly for a normal spread of outcomes, the close would be outside its breakevens about 42% of the time. The counts below sit beside that line. The study draws no conclusion beyond the counts.
What we found
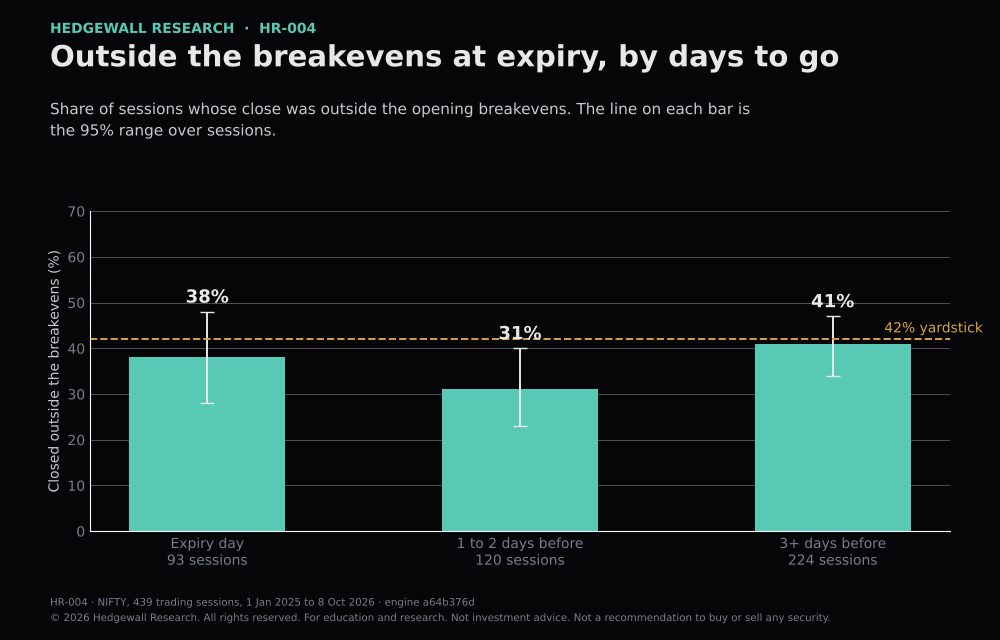
Measured from the opening reading, the close was outside the breakevens on 35 of 93 (38%, range 28% to 48%) of expiry days, 37 of 120 (31%, range 23% to 40%) of sessions one or two days before expiry, and 91 of 224 (41%, range 34% to 47%) of sessions three or more days before. The one to two days group sits below the 42% line; the other two ranges include it. The median distance of the close from the strike was 0.80, 0.71 and 0.78 times the straddle's price in the three groups.
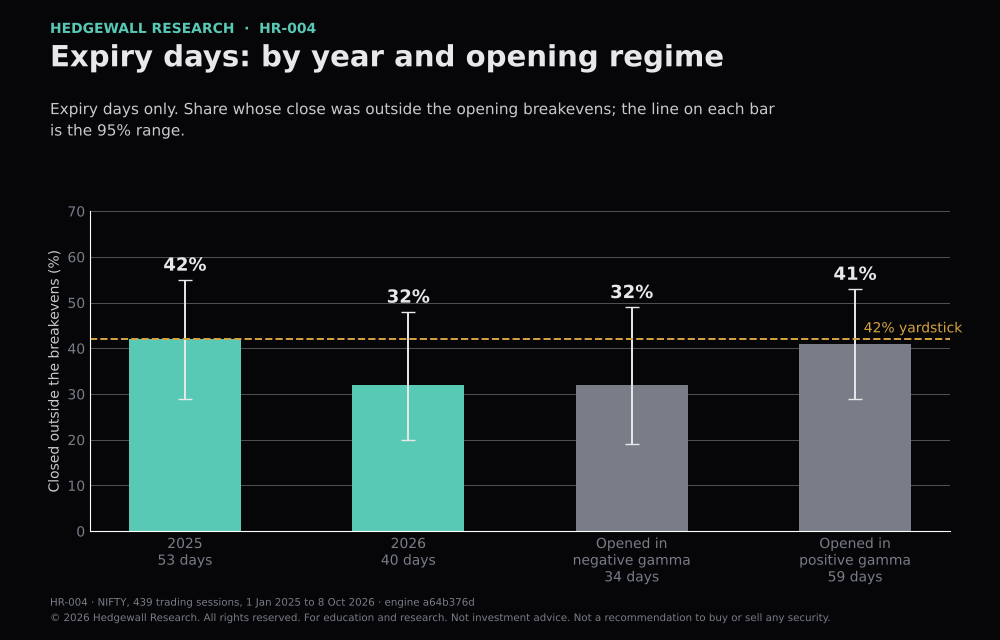
On expiry days the figure was 22 of 53 (42%, range 29% to 55%) in 2025 and 13 of 40 (32%, range 20% to 48%) in 2026. Sessions that opened in negative gamma finished outside on 11 of 34 (32%, range 19% to 49%) of expiry days, against 24 of 59 (41%, range 29% to 53%) for sessions that opened in positive gamma. One or more days before expiry the pair was 31 of 82 (38%, range 28% to 49%) and 97 of 262 (37%, range 31% to 43%). The ranges overlap within every pair: this data cannot separate the years, or the two regimes.
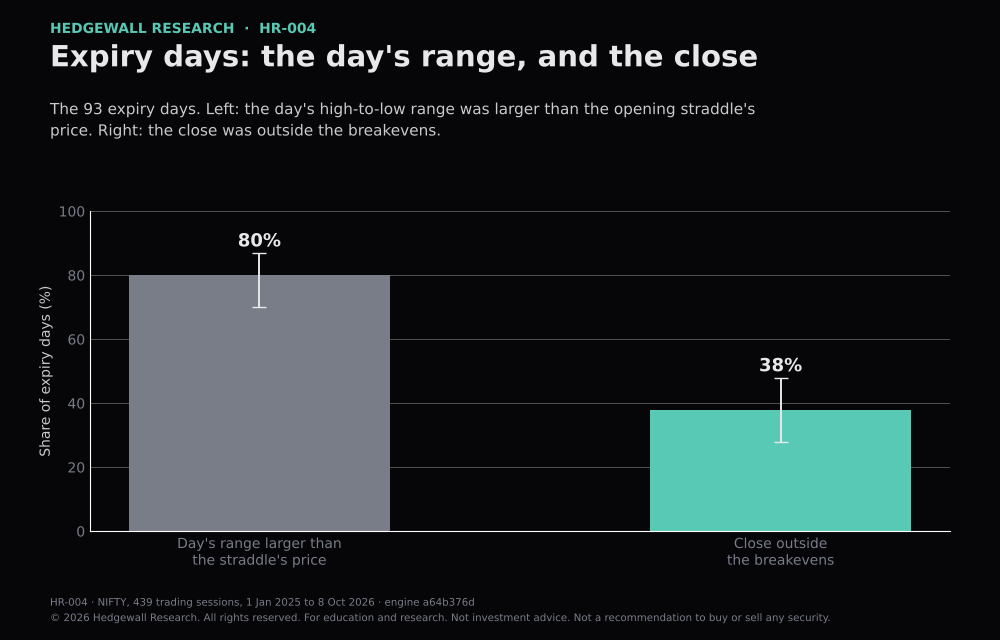
On expiry days, the day's high-to-low range was larger than the opening straddle's price on 74 of 93 (80%, range 70% to 87%) of days, with a median range of 1.43 times the price. The close was outside the breakevens on 35 of 93. A range larger than the price does not put the close outside the breakevens: the index can travel a long way and finish near the strike.
The charts
What this does not show
- NIFTY only, 439 sessions from 1 Jan 2025 to 8 Oct 2026. 437 of them have their expiry session in the data and are counted in the first figures: 93 expiry days, 120 sessions one or two days out and 224 three or more days out. The year and regime splits are smaller, so their ranges are wide.
- The opening reading is taken at 09:16:30 from last traded prices, which for some strikes are the first prices of the day. The straddle's price at that moment is not a price anyone could necessarily have traded at.
- The close is the last five-minute reading (15:25) of the expiry session, not the exchange's settlement value, so a close within a few points of a breakeven could fall on either side.
- This counts closes against levels. It says nothing about returns, costs, hedging, or what any position earned, and the straddle's price changes after the open, which the breakevens do not follow.
- A range that includes the 42% line means the data cannot separate that group from the yardstick, and a yardstick built on a normal spread is not a model of the market.
- Nothing here says where the index goes next, and the regime is the label at the opening reading only; it can change within the day.
Method
- Data: exchange tick data for NIFTY index options and the index level, 1 Jan 2025 to 8 Oct 2026, from a licensed provider. Only aggregate results are published; the tick data is not.
- Breakevens: the product's own straddle_point function (engine/straddle.py) on a chain built the way the product builds it. The at-the-money strike is the one nearest the forward among strikes with both legs priced, and the breakevens are that strike plus and minus the call price plus the put price.
- Outcome: the index at the last five-minute reading of the expiry session. Opening regime: the product's own gamma regime label at the opening reading.
- Ranges are 95% ranges for a share of sessions (the Wilson interval), computed from the counts shown beside them. Read a range as the span of shares the counts are consistent with.
- Yardstick: for a normal spread of outcomes whose average absolute move equals the straddle's price, the chance the close is further than that price from the strike is about 42%.
- Engine commit a64b376d. The replay script is in replay/hw_batch_study.py (the breakeven test is the first question in it); run it on the tick files to reproduce every figure.
Downloads
Cite as
Hedgewall Research, HR-004, v1, 27 Oct 2026.
Link to hedgewall.in/research/hr-004/. Quoting a short passage with a clear credit is permitted; see the terms of use.