Unusual volume: does a burst move the option, and what does open interest do next?
NIFTY, 435 trading sessions, 1 Jan 2025 to 8 Oct 2026
The question
When the Unusual volume pane flags a burst of trading in one option, does that option's price move more than it usually does? Which side initiated the trades, the one paying the ask or the one hitting the bid? And what does open interest at that strike do over the next 10 minutes?
In plain words
A burst is the pane's own rule. In a step of about a minute, one option trades at least four times its own average volume per minute so far that day, at least the median volume of the options trading in that step, and at least ₹3.5 Cr a minute (volume times price, a rounded figure; this is the NIFTY floor). Back-to-back burst minutes on one option count as one burst.
Open interest is the quantity of contracts still open at a strike. When trades happen it can rise (new positions are opened), fall (old positions are closed) or stay the same (positions change hands). This study looks at which way it moved at the burst's strike over the 10 minutes after the burst ended.
To say which side initiated a trade, each trade is compared with the best bid and ask just before it. A trade at or above the ask is buyer-initiated, and at or below the bid is seller-initiated. A burst is buyer-led when at least 60% of its volume was buyer-initiated, seller-led when at least 60% was seller-initiated, and mixed otherwise. This says which side initiated, not who the trader is.
What we found
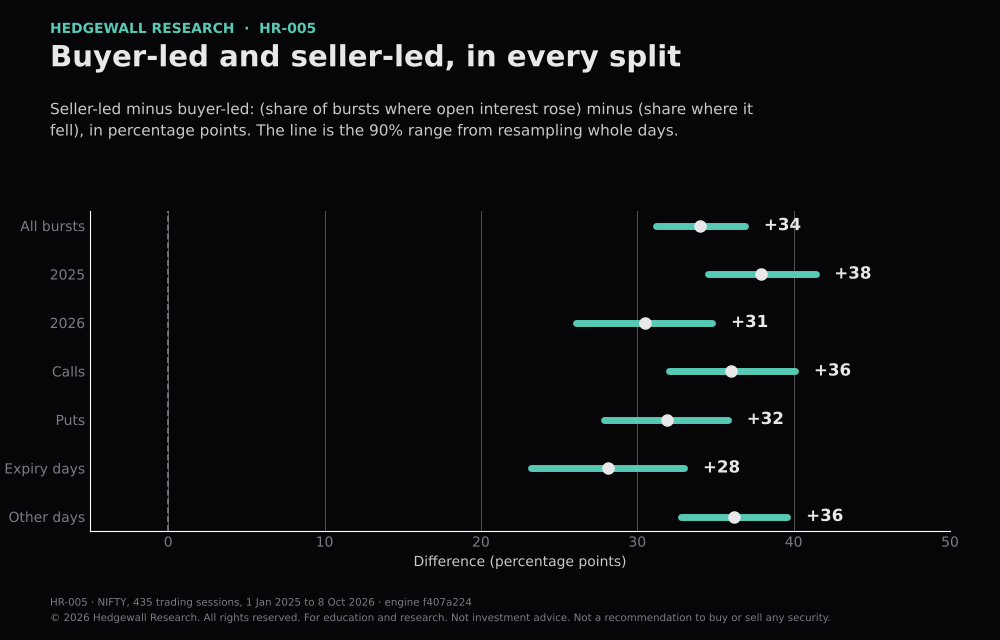
Seller-led minus buyer-led, in the share of bursts where open interest rose minus the share where it fell: 34 points, range 31 to 37.
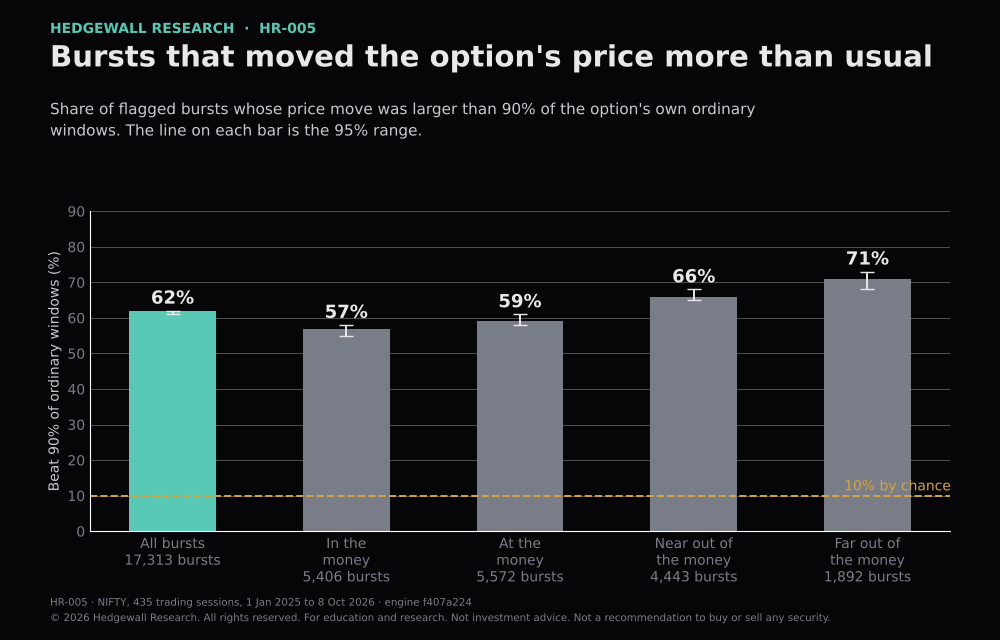
Of 17,313 bursts that could be compared, 10,662 (62%, range 61% to 62%) moved the option's price more than 90% of that option's own ordinary windows. About 10% would by chance. 2,611 (15%, range 15% to 16%) did not spike: their price move was below the middle of the ordinary windows. The share was 5,185 of 8,109 (64%, range 63% to 65%) in 2025 and 5,477 of 9,204 (60%, range 59% to 61%) in 2026, and 3,059 of 5,109 (60%, range 59% to 61%) on expiry days against 7,603 of 12,204 (62%, range 61% to 63%) on other days. It rises with distance from the money: 57% in the money, 59% at the money, 66% near out of the money and 71% far out of the money.
Of the 20,101 bursts, 4,985 (25%, range 24% to 25%) were buyer-led, 3,504 (17%, range 17% to 18%) seller-led and 11,612 (58%, range 57% to 58%) mixed. Far out of the money 36% were buyer-led against 14% seller-led; in the money the two were close (26% and 23%). Where a burst's price moved and one side clearly led, the price moved the same way as that side on 95% of 8,474 bursts.
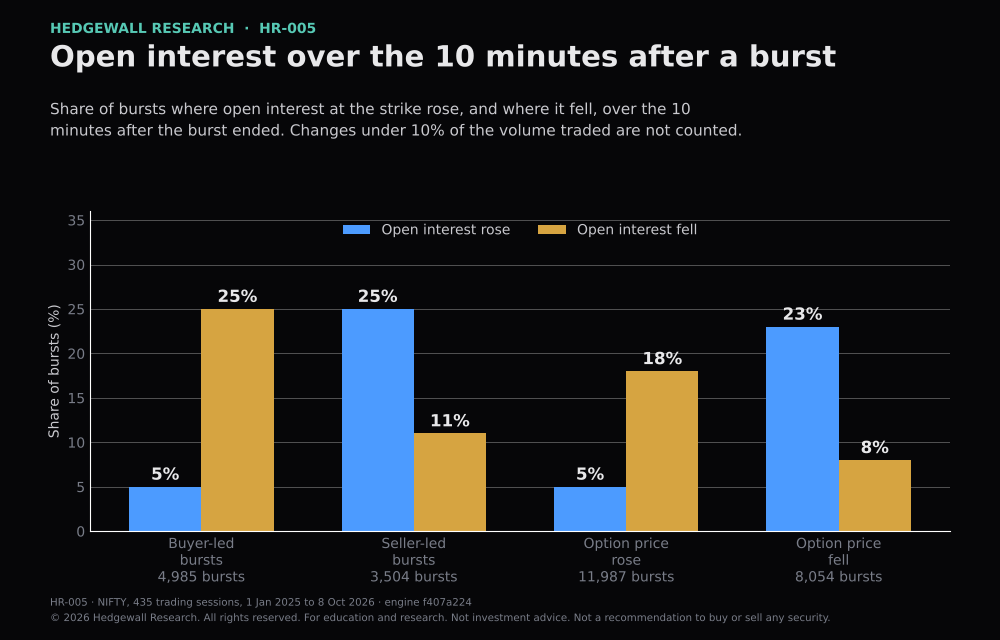
Over the 10 minutes after a buyer-led burst ended, open interest at the strike fell on 25% of bursts and rose on 5%, so it fell 5 times as often as it rose. In ordinary windows of the same options it fell on 11% and rose on 10%. After a seller-led burst it rose on 25% and fell on 11% (ordinary windows: 15% and 12%). Only changes of at least 10% of the volume traded in the window are counted, so on 70% of buyer-led bursts and 64% of seller-led bursts there was no clear change. Counting the share of bursts where open interest rose minus the share where it fell, seller-led bursts sit 34 points above buyer-led ones (range 31 to 37 points over 432 days).
The difference has the same sign in 2025 (38 points) and 2026 (31), for calls (36) and puts (32), and on expiry days (28) and other days (36); every range is above zero. NSE's own end-of-day open interest change points the same way but weakly: it fell at 30% of the 2,634 strike-days where only buyer-led bursts occurred and at 25% of the 1,289 where only seller-led bursts occurred. Among bursts not followed by another burst, the option's price kept moving the same way over the next 10 minutes after a buyer-led burst on 30% of bursts, against 49% in ordinary windows (after a seller-led burst: 44% against 48%).
The charts
What this does not show
- NIFTY only, 435 sessions from 1 Jan 2025 to 8 Oct 2026: two years and one index. Bursts on one day are not independent, which is why the ranges on the difference resample whole days.
- "Moved more than usual" compares the price move during the burst with ordinary windows of the same option on the same day. Windows where the option did not trade are left out, because a price cannot move without a trade. 17,313 of the 20,101 bursts had enough ordinary windows to be compared; the rest are not in the 62% or the 15%.
- Which side initiated a trade is inferred from its price against the bid and ask just before it: 95% of traded shares were placed by that rule, 4% by the midpoint and 1% by the direction of the last price change. It says nothing about who the trader is.
- Open interest is net for everyone trading at that strike. A fall after a buyer-led burst is what positions closing looks like; it does not show that the burst's own buyers closed them. On 70% of buyer-led bursts the change was too small to count, so this is a lean, not a rule for any one burst.
- The cut (10% of the volume traded) and the window (10 minutes) were fixed before the results were read. At a 5% cut the pattern is the same (buyer-led: fell 48%, rose 9%); at a 20% cut it fades (fell 7%, rose 2%), because large changes are rare.
- The pane's own opening, closing or churn label (open interest change over the burst's volume, cut at 0.5, read at the end of the burst) reads churn on 19,905 of 20,101 bursts, so it separates very little. This study reads open interest over a longer window with a smaller cut. The pane does not show the buyer-led or seller-led read, or the 10-minute read.
- Nothing here says where the index goes next. It describes what happened after a burst, on past data, and is not a forecast or advice.
Method
- Data: exchange tick data for NIFTY index options and the index level, 1 Jan 2025 to 8 Oct 2026, from a licensed provider. Only aggregate results are published; the tick data is not.
- Bursts: the pane's own rule (api/services/uvol_time.py), recomputed from the tick data and matched on every burst. Near the money means within 1 strike of the index, near out of the money 2 to 5 strikes, far out of the money 6 or more.
- Spike test: the price move during the burst, compared with ordinary windows of the same option, same day and same length, within 45 minutes either side, with no burst, where the option traded in the last minute. "More than usual" means above 90% of those windows, which would happen about 10% of the time by chance.
- Side: each trade against the best bid and ask just before it (quote rule 95%, midpoint 4%, last price change 1%). Buyer-led and seller-led need 60% or more of the burst's volume.
- Open interest: the change at the burst's strike from the start of the burst to 10 minutes after it ended, divided by all the shares traded in that window. "Rose" is +0.1 or more and "fell" is -0.1 or less. The comparison windows are the same option's ordinary windows of the same length on the same day.
- Ranges: shares have a 95% range (the Wilson interval) computed from the counts beside them. The difference has a 90% range from resampling whole trading days 2,000 times. Read a range as the span of values the data is consistent with.
- Engine commit f407a224. The scripts are in replay/: hw_burst_ticks.py (trades by side), hw_burst_proof.py (the rule and the spike test), hw_burst_who.py and hw_burst_checks.py (side, open interest, checks) and hw_burst_summary.py (this study's figures). Run them on the tick files to reproduce every figure.
Downloads
Cite as
Hedgewall Research, HR-005, v1, 14 Nov 2026.
Link to hedgewall.in/research/hr-005/. Quoting a short passage with a clear credit is permitted; see the terms of use.