The Straddle decay clock: does it keep its word?
NIFTY, 439 trading sessions, 1 Jan 2025 to 8 Oct 2026
The question
The Straddle decay clock pane draws how much of its morning price today's at-the-money straddle still has, against what past days of the same kind did. Is its usual line a good guide to a day? Does its band hold as many days as it says? And does its faster, in line or slower label tell you anything about the rest of the day?
In plain words
A straddle is a call and a put at the same strike, held together. Its price is what the market charges for a day's movement, and it melts as the day goes on. The Straddle decay clock pane draws that melt for today and puts it next to what past days did.
Everything is a share of the morning price. If the straddle cost ₹100 at 09:20 and costs ₹80 later, it has 80% of its morning price left. Past days are grouped by how many trading days were left to the expiry, because the melt is very different on expiry day than on the days before it.
The pane draws a usual line (the middle of past days of the same kind) and a band around it (where most past days were). A day below the band is melting faster than usual, a day above it slower, and a day inside it is in line. Every test below builds the usual line and the band for a day from earlier days only, as the pane does when it runs.
The four pictures
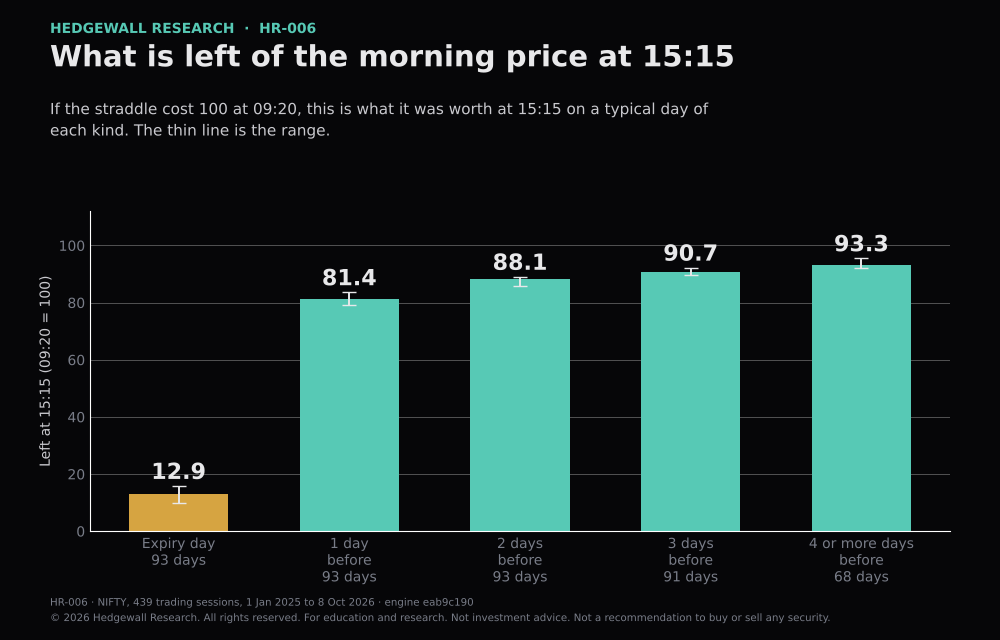
The melt depends on the kind of day. On expiry day most of the price is gone by the afternoon; four days out, almost all of it is still there.
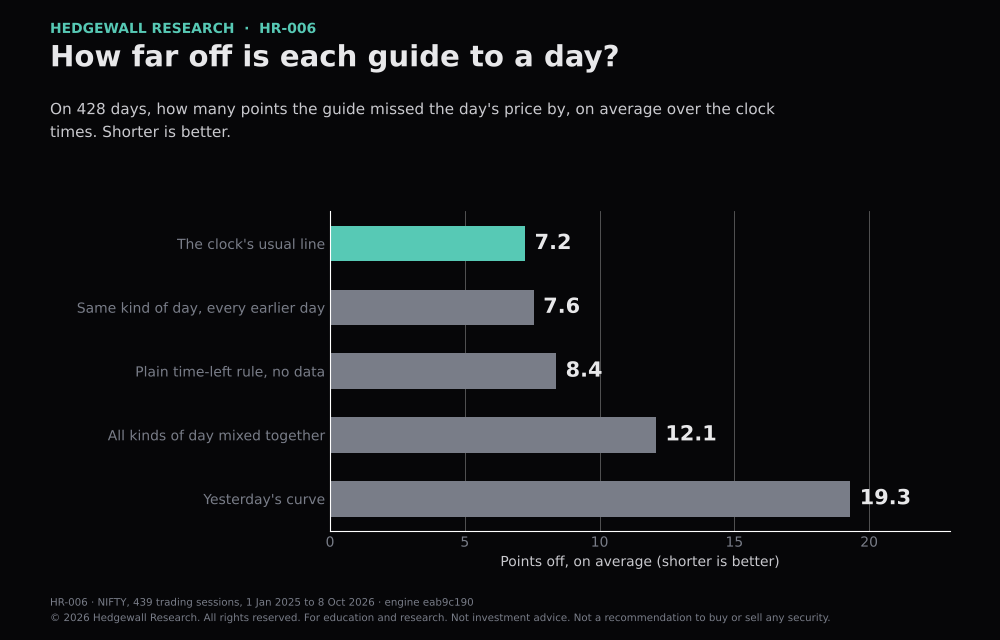
The clock's usual line is the closest guide of the five. Mixing all kinds of day together misses by much more, and yesterday's curve by most.
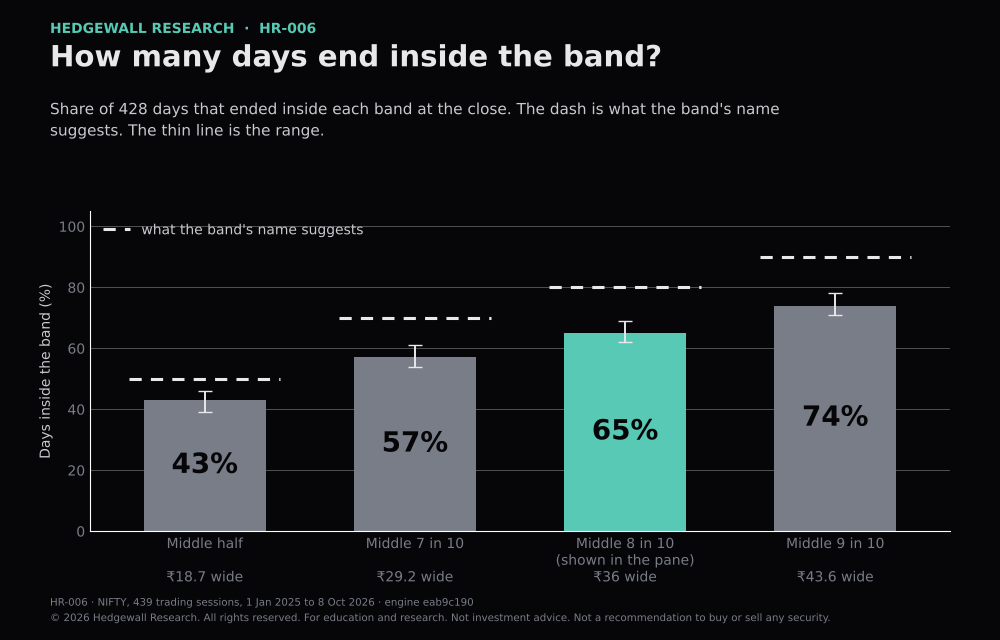
A wider band holds more days, but every band holds fewer days than its name suggests. The band the pane shows holds 65% of days, about 2 in 3.
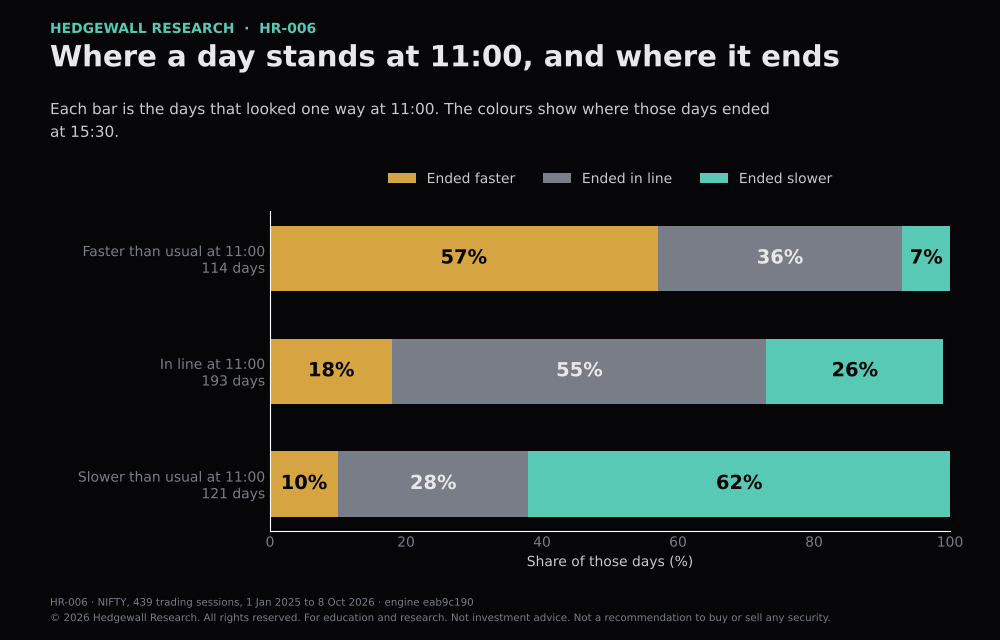
A day that is melting faster or slower than usual at 11:00 mostly ends the same way. The label says where the day stands; it does not say the rest of the day will be unusual.
What we found, in words
The melt depends on how close the expiry is. By 15:15 the typical straddle had 12.9% of its morning price left on expiry day, 81.4% one day before, 88.1% two days before, 90.7% three days before and 93.3% four or more days before (ranges: 9.9% to 15.8% on expiry day, 92.0% to 95.5% four or more days before). That is why the pane groups days by kind: on expiry days, a guide that mixed all kinds of day together was 20.7 points further off than the clock's; on the other four kinds it made little difference (-0.3 to +2.1 points).
Across the 15-minute clock times of 428 days, the clock's usual line missed the day's share by 7.2 points on average. The same guide built from every earlier day of that kind (not only the last 90 days) missed by 7.6, a plain rule that only counts the time left by 8.4, all kinds of day mixed together by 12.1 and yesterday's curve by 19.3. Each is further off than the clock's, by 0.3, 1.1, 4.8 and 12.1 points (all ranges above zero). So the usual line is a good description of a typical day, and the margin over a simple time-left rule is small: 1.1 points.
The pane's band shows where most days finish. At the close it held 65% of 428 days (range 62% to 69%), about 2 in 3, which is how the pane words it. A narrower band, the middle half of earlier days, held 43%; wider ones held more: 57% for the middle 7 in 10 and 74% for the middle 9 in 10. Every band held fewer days than its name says, because new days vary more than the last 90 days suggest. With only 2 to 6 earlier days behind it, the band the pane shows held 53% of readings, against 70% with 7 to 12 earlier days, so the pane shows a band only when at least 7 earlier days stand behind it.
At 11:00, 27% of days were melting faster than the band, 45% in line and 28% slower. A day that was faster at 11:00 ended faster on 57% of days and slower on 7%; a day that was slower ended slower on 62% and faster on 10%. But from 11:00 on, the rest of the day did not melt differently from usual for any label: the differences were small and every range includes zero, and 2025 and 2026 did not agree. So the label describes where the day stands, which is what the pane says; it does not say the rest of the day will be unusual.
The pane's numbers are what it says they are. The usual line and the band equal an independent recomputation on 10,950 of 10,950 clock times, every reading equals an independent reading of the raw rows on 10,950 of 10,950, the label equals the independent label on 856 of 856 days, and the pane draws nothing after the clock when cut at 11:00 or 13:00 (0 breaches).
What this does not show
- NIFTY only, 438 usable sessions from 1 Jan 2025 to 8 Oct 2026: two years and one index. Sessions on the same day are not independent, which is why the ranges resample whole days.
- The tests rebuild each straddle from the quotes taken every 5 minutes, not from the pane's own readings every 30 to 48 seconds, and the pane's live clock after 8 Oct 2026 is not covered. The first days of 2025 have fewer earlier days behind them, so their usual line is less steady.
- Every band held fewer days than its name says, even the widest (the middle 9 in 10 held 74%). The percentages in this study are what the bands held on these days, not what they will hold.
- Where fewer than 7 earlier days stand behind a band it is unreliable: the band the pane shows held 53% of readings and even the middle 9 in 10 held 58%. The pane shows a band only from 7 earlier days.
- The label says where a day stands, not what comes next. Days with each label did not melt differently from usual for the rest of the day, and a straddle can also gain value; the pane says so.
- The pane's text says the line follows the strike nearest the index; the code uses the strike nearest the forward price (the level the market's own prices imply for the index). The two differ on 37% of 32,412 readings, by typically ₹4.2 on the straddle, and would move a day's 15:15 share by typically 0.3 points (on the largest tenth of days by 3 or more). The line also changes strike typically 16 times a session, in steps of typically 1.3 points. This study reports the difference and changes neither the code nor the wording.
- Nothing here says where the index or the straddle goes next. It describes past days and what the pane drew, and is not a forecast or advice.
Method
- Data: exchange tick data for NIFTY index options and the index level, 1 Jan 2025 to 8 Oct 2026, from a licensed provider. Only aggregate results are published; the tick data is not.
- The clock: the pane's own code (api/services/straddle_clock.py) runs on the rebuilt straddles. Each day's straddle (call and put at the strike nearest the forward price, front expiry) is read at 09:20 and at every 15 minutes up to 15:30, and shown as a share of the 09:20 price. Days are grouped by trading days to the expiry (0, 1, 2, 3, 4 or more). The usual line is the middle of earlier days of the same kind within the last 90 days; the band is the part of them between two cut points.
- No look-ahead: days are taken in order, and each day's usual line and band use earlier days only. 438 of 439 sessions had a clean 09:20 reading and an expiry; 428 days had every guide in the comparison.
- Guides: the clock's usual line; the same line from every earlier day of that kind; all kinds mixed together over 90 days; the previous session's own curve; and a rule using only the time left. A guide's miss is the average gap between the day's share and the guide, over the clock times.
- Bands: the middle half (25th to 75th), the middle 7 in 10 (15th to 85th), the middle 8 in 10 (10th to 90th) and the middle 9 in 10 (5th to 95th) of earlier days, built the same way. A band holds a day when the reading falls inside it.
- Ranges: the ranges on differences and on the shares of days are the 90% range from resampling whole trading days 2,000 times. Read a range as the span of values the data is consistent with. Where a report printed only a rounded percentage, the summary holds that percentage, not a count it did not print.
- Checks: the usual line, the band, the clock-time readings and the label are recomputed independently from the raw straddle series and compared on all 10,950 clock times.
- Engine commit eab9c190. The script is in replay/: hw_decay_clock_test.py (needs the 5-minute quote files and a checkout of that commit). Run it to reproduce every figure.
Downloads
Cite as
Hedgewall Research, HR-006, v1, 15 Nov 2026.
Link to hedgewall.in/research/hr-006/. Quoting a short passage with a clear credit is permitted; see the terms of use.