

26 October 2026
MON 26 OCT 2026 · 15:40 IST
NIFTY closed 0.04 percent over its gamma flip, in a positive-gamma regime.
All 3 fell below their opening print in the morning, ground back through the afternoon, and shut inside ranges no wider than 1.59 percent.
Where each index closed
The bar is the sampled range. The dark notch is the first sample, the blue block is the close. The ladder below it shows where the close sat against the strikes that mattered.
| Max gamma strike + call wall 246.80 pts above | 23,000.00 | |
| CLOSE | 22,753.20 | |
| Gamma flip 9.88 pts below | 22,743.32 | |
| Put wall 153.20 pts below | 22,600.00 |
Opened 22,478.90, fell 82.35 points, then walked all the way back and closed at the highest price we sampled. It finished between the gamma flip at 22,743 and the max gamma strike + call wall at 23,000, 246.80 points under the nearer one above. Hedging dampens from here.
- Regime
- POSITIVE GAMMA
- Net GEX
- +1,217 Cr
- ATM IV
- 19.97%
- Expiry
- 1.00 days to 2026-10-27
| Max gamma strike + call wall 633.30 pts above | 55,000.00 | |
| CLOSE | 54,366.70 | |
| Gamma flip 149.95 pts below | 54,216.75 | |
| Put wall 366.70 pts below | 54,000.00 |
Opened 54,216.95 and spent the day below it, low to 53,800.90, before closing 54,366.70. It finished between the gamma flip at 54,217 and the max gamma strike + call wall at 55,000, 633.30 points under the nearer one above. Hedging dampens from here.
- Regime
- POSITIVE GAMMA
- Net GEX
- +777 Cr
- ATM IV
- 20.85%
- Expiry
- 1.00 days to 2026-10-27
| Max gamma strike 1,393.25 pts above | 75,000.00 | |
| Call wall 393.25 pts above | 74,000.00 | |
| Gamma flip 167.99 pts above | 73,774.74 | |
| CLOSE | 73,606.75 | |
| Put wall 606.75 pts below | 73,000.00 |
Opened 72,784.73, fell 237.89 points, then walked all the way back and closed at the highest price we sampled. It finished between the put wall at 73,000 and the gamma flip at 73,775, 167.99 points under the nearer one above. Hedging amplifies from here.
- Regime
- NEGATIVE GAMMA
- Net GEX
- −979 Cr
- ATM IV
- 20.40%
- Expiry
- 3.00 days to 2026-10-29
Delta · which side is heavy
Calls to the right in gold, puts to the left in violet, all three on one shared scale. Net is what survives when they cancel.
Flows · the book against today
The first bar is every open contract that exists. The second is only what changed today. Opposite directions mean today pushed against the position rather than adding to it.
Look at the SENSEX pair in Flows. The standing book is long 623 Cr of delta while today’s flow was short 7,678 Cr, 1233 percent of it, the other way.
How to read the ladders
- Call wall heaviest call open interest above spot
- Put wall heaviest put open interest below spot
- Gamma levels max gamma strike, zero gamma, the flip
- Close where it actually finished
What these numbers are
Open, high and low mean the first, highest and lowest of 635 samples taken between 09:15 and 15:39 IST, not the exchange’s official prints, and the close is the last price we sampled rather than the settlement price. GEX is normalised to five days and compares across days for one index, never between indices. Volume reads zero at every strike after the close, so no volume figure appears above.
The card posts with it. Long press to save the image, or use the button and X will attach it from the link.
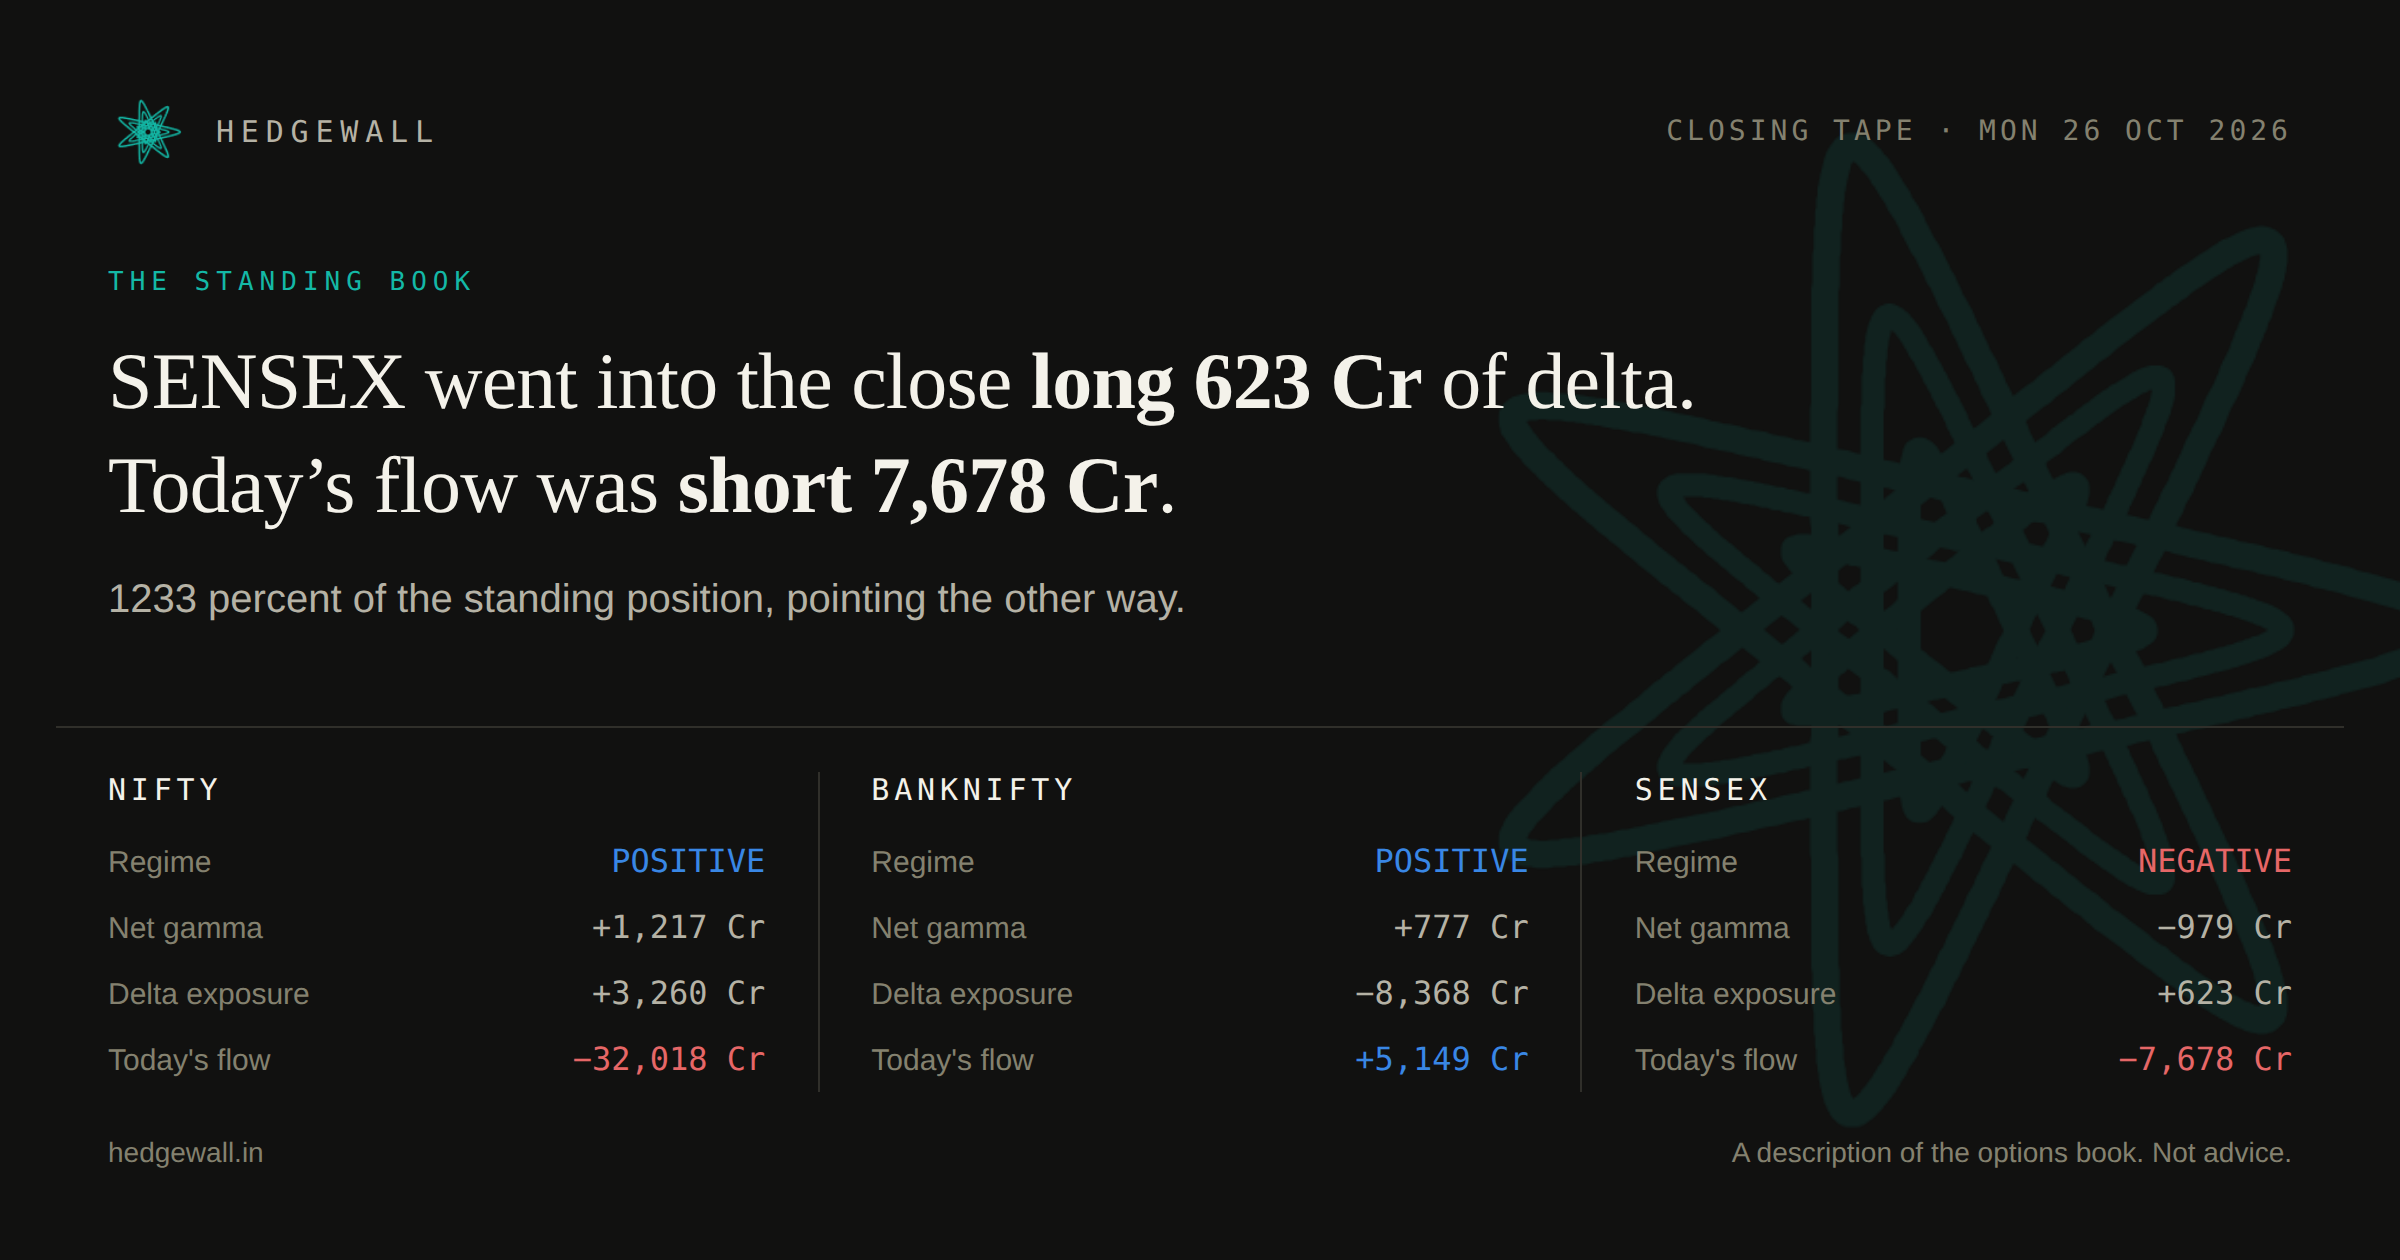
SENSEX went into the close long 623 Cr of delta. Today's flow was short 7,678 Cr. 1233 percent of the standing position, pointing the other way.