
The Closing Tape, every day
One page after each trading day's close, kept here by date. Pick a day on the calendar, or scroll the cards. Each page is shown as it was published that day.
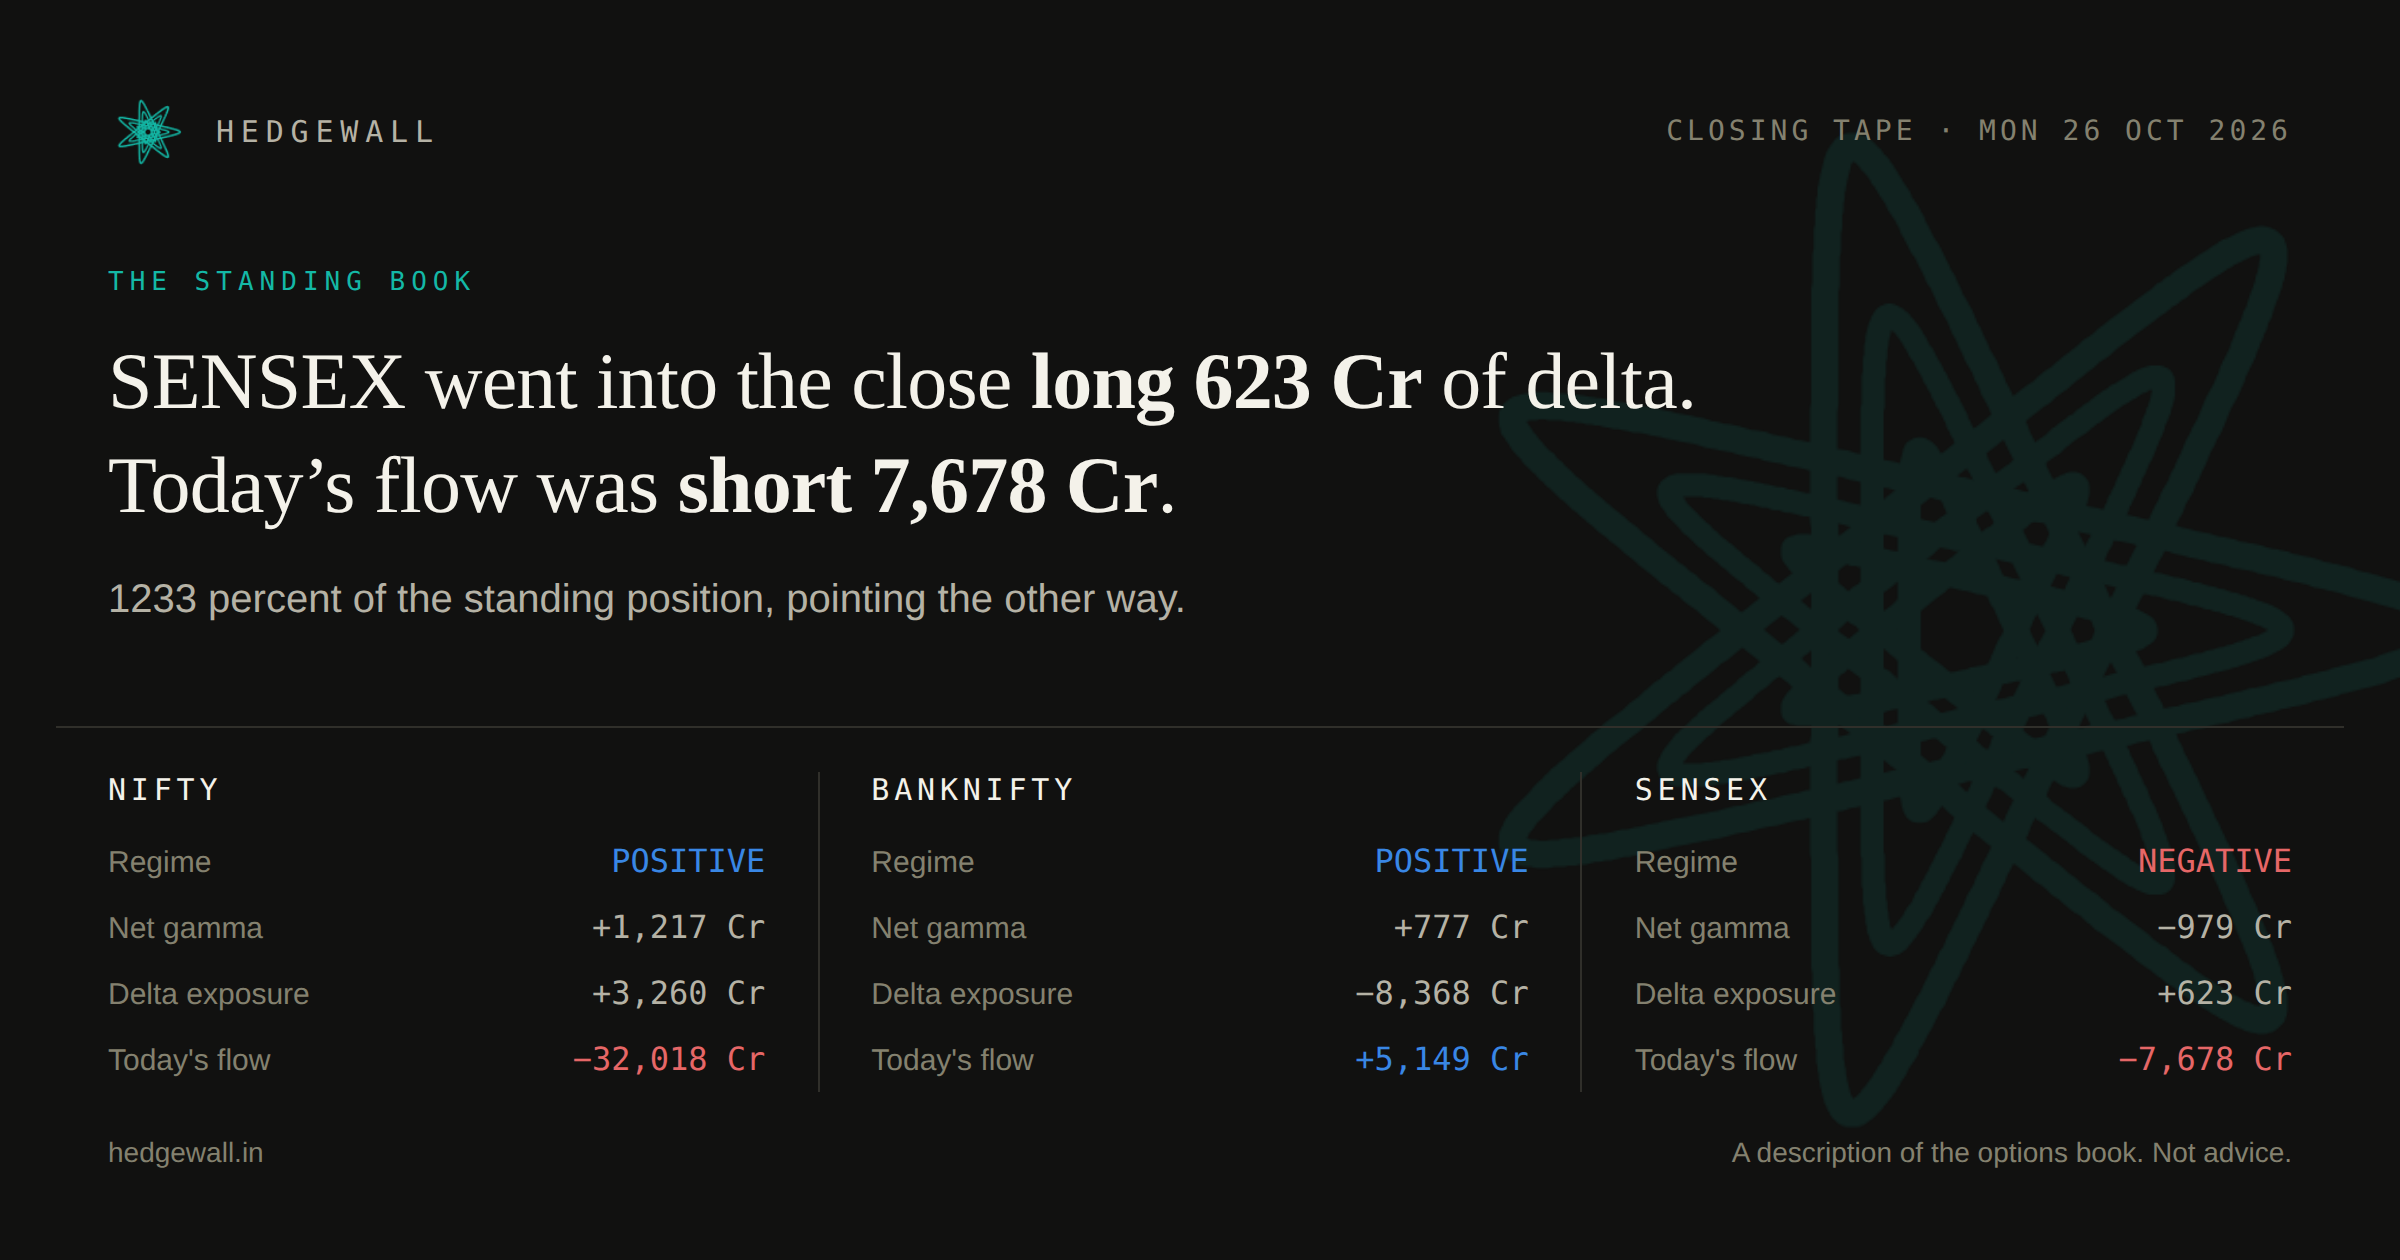
Latest · Mon 26 Oct 2026
NIFTY closed 0.04 percent over its gamma flip, in a positive-gamma regime.
Open this tape- Tapes published
- 29 15 with clear figures, 14 where the data is not clear
- First
- Fri 11 Sep 2026
- Latest
- Mon 26 Oct 2026
Calendar
Tape published, figures clear
Tape published, figures not clear
Trading day, no tape published
Market closed
October 2026
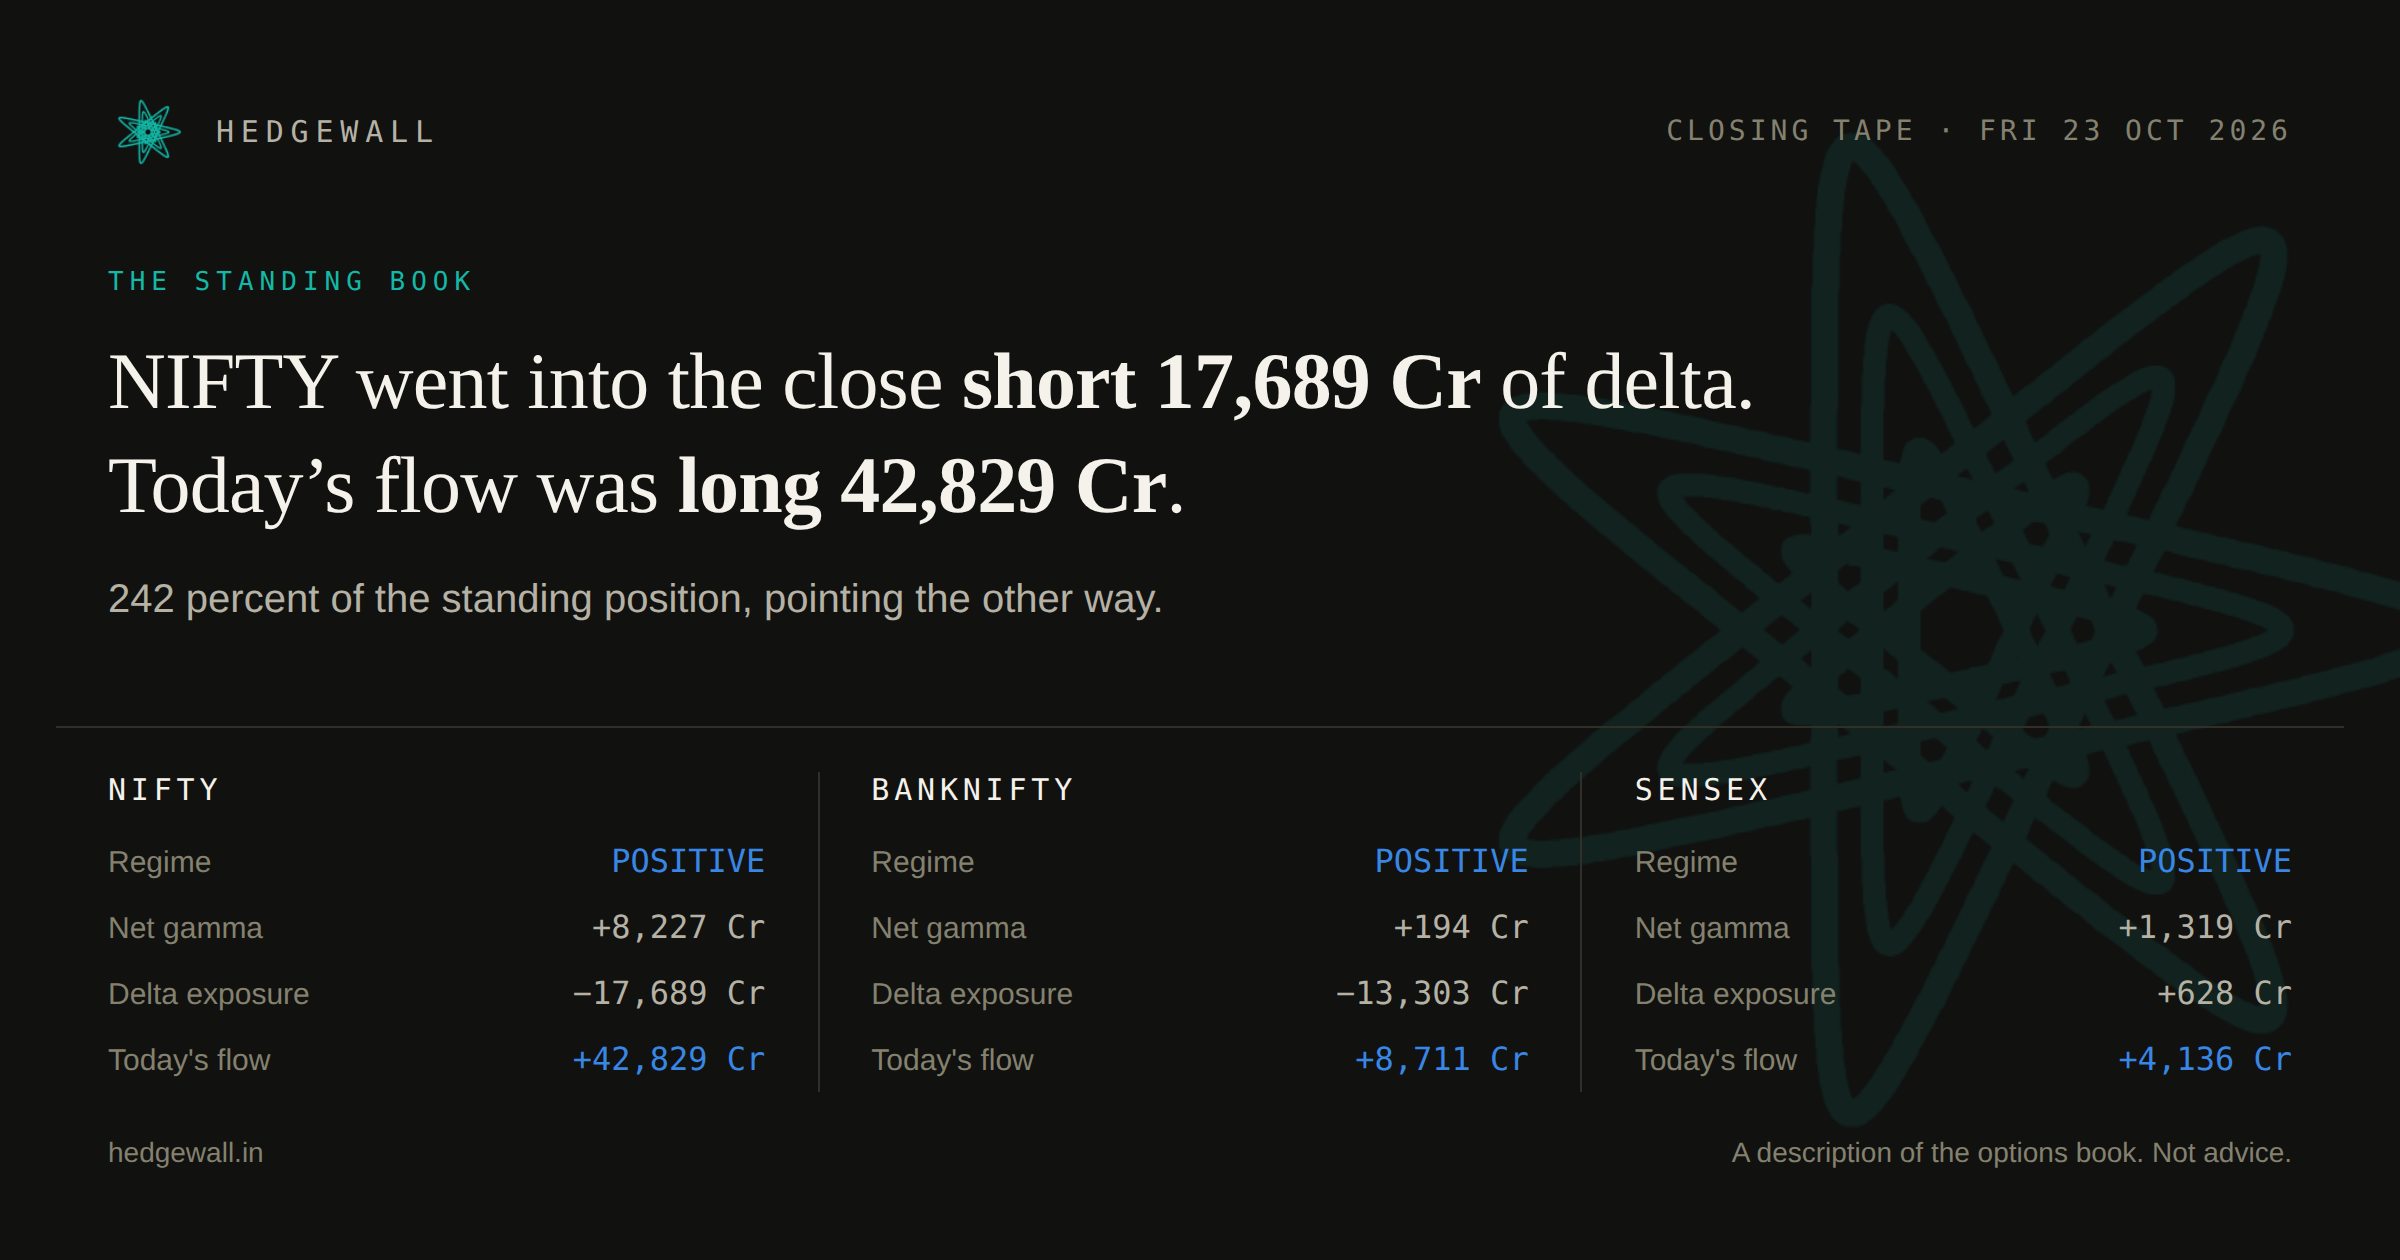
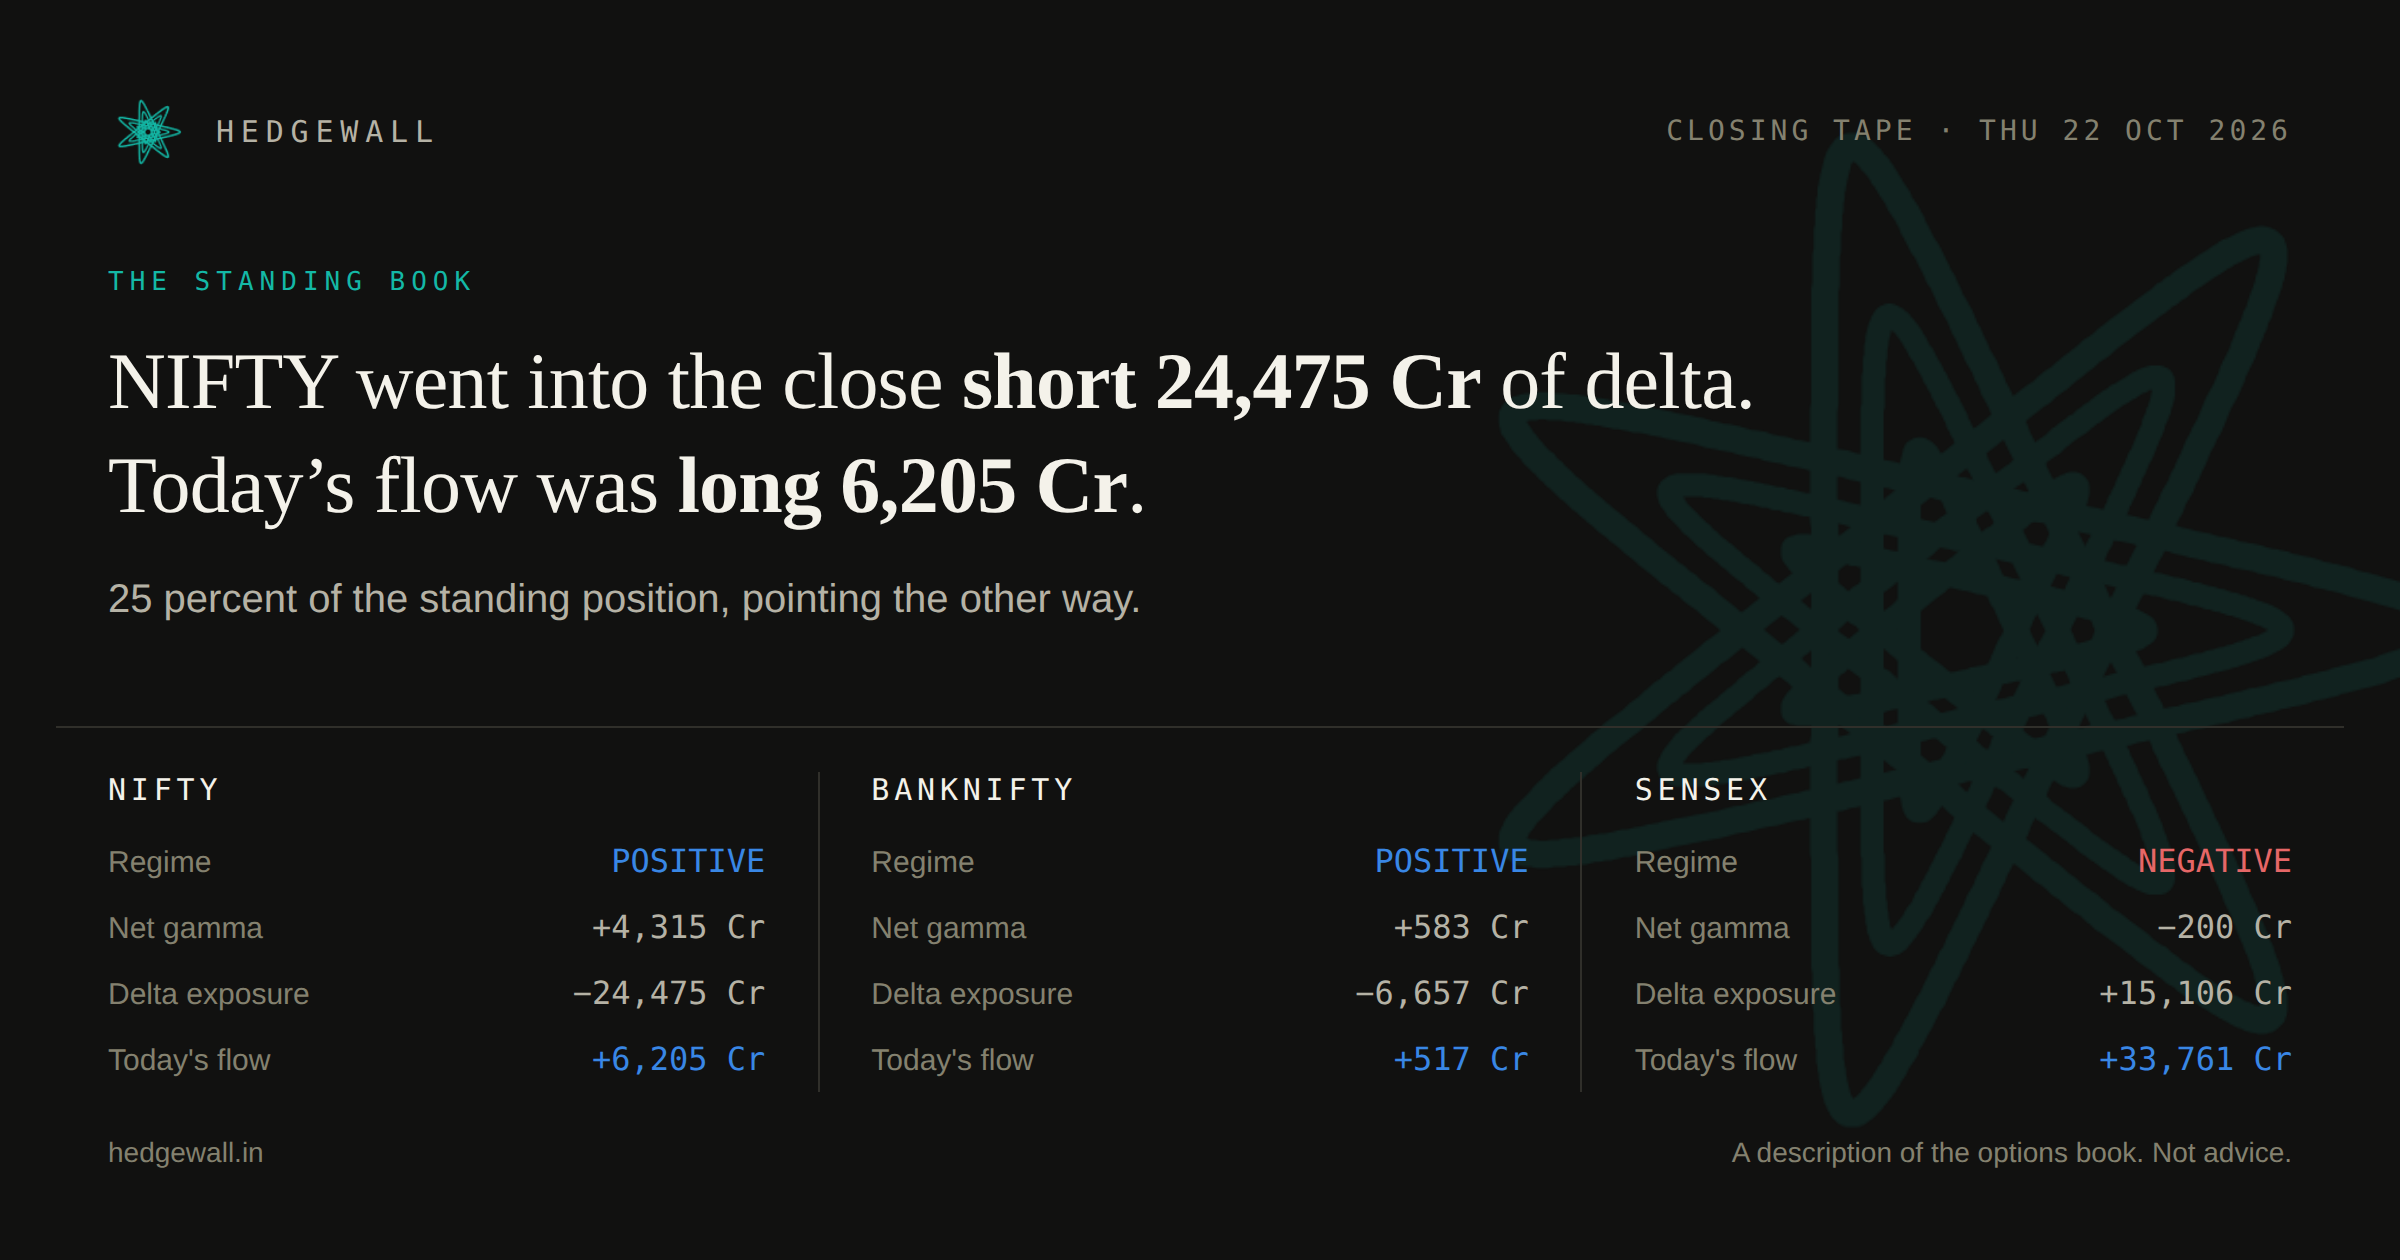
SENSEX sat on its gamma flip, in a negative-gamma regime.
NIFTY22,687.65+0.399%
positive gamma
GEX +4,315 Cr · Delta -24,475 Cr · Flow +6,205 Cr
BANKNIFTY54,925.70+0.752%
positive gamma
GEX +583 Cr · Delta -6,657 Cr · Flow +517 Cr
SENSEX73,249.39+0.187%
negative gamma · expiry day
GEX -200 Cr · Delta +15,106 Cr · Flow +33,761 Cr
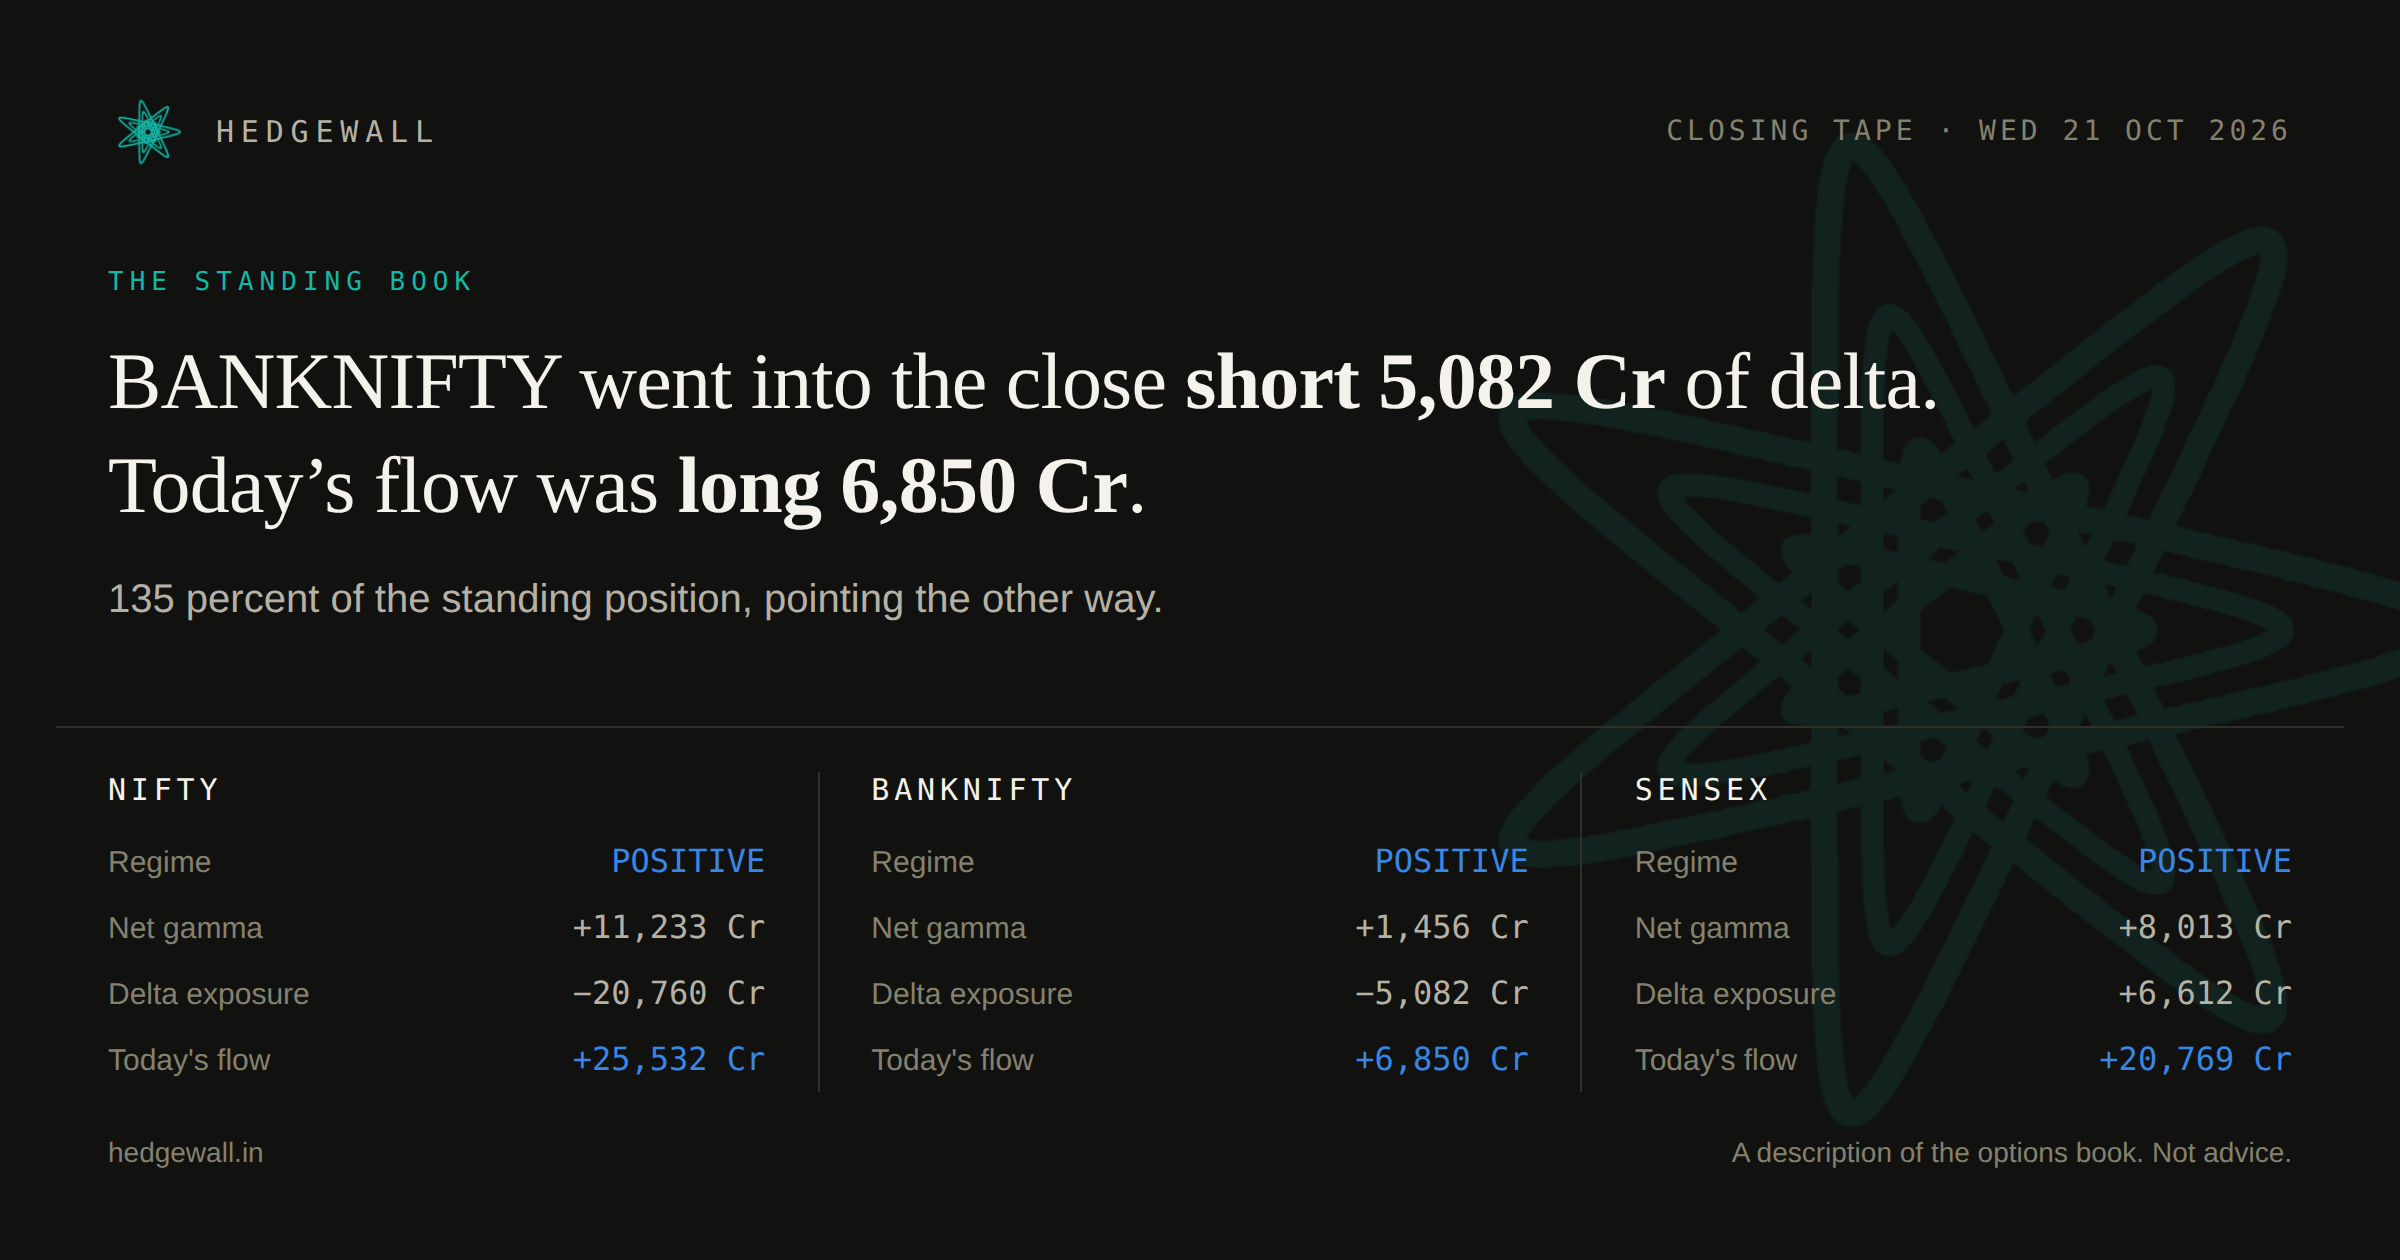
SENSEX closed 0.36 percent over its gamma flip, in a positive-gamma regime.
NIFTY22,811.35-1.043%
positive gamma
GEX +11,233 Cr · Delta -20,760 Cr · Flow +25,532 Cr
BANKNIFTY54,976.90-1.215%
positive gamma
GEX +1,456 Cr · Delta -5,082 Cr · Flow +6,850 Cr
SENSEX73,709.69-0.737%
positive gamma
GEX +8,013 Cr · Delta +6,612 Cr · Flow +20,769 Cr
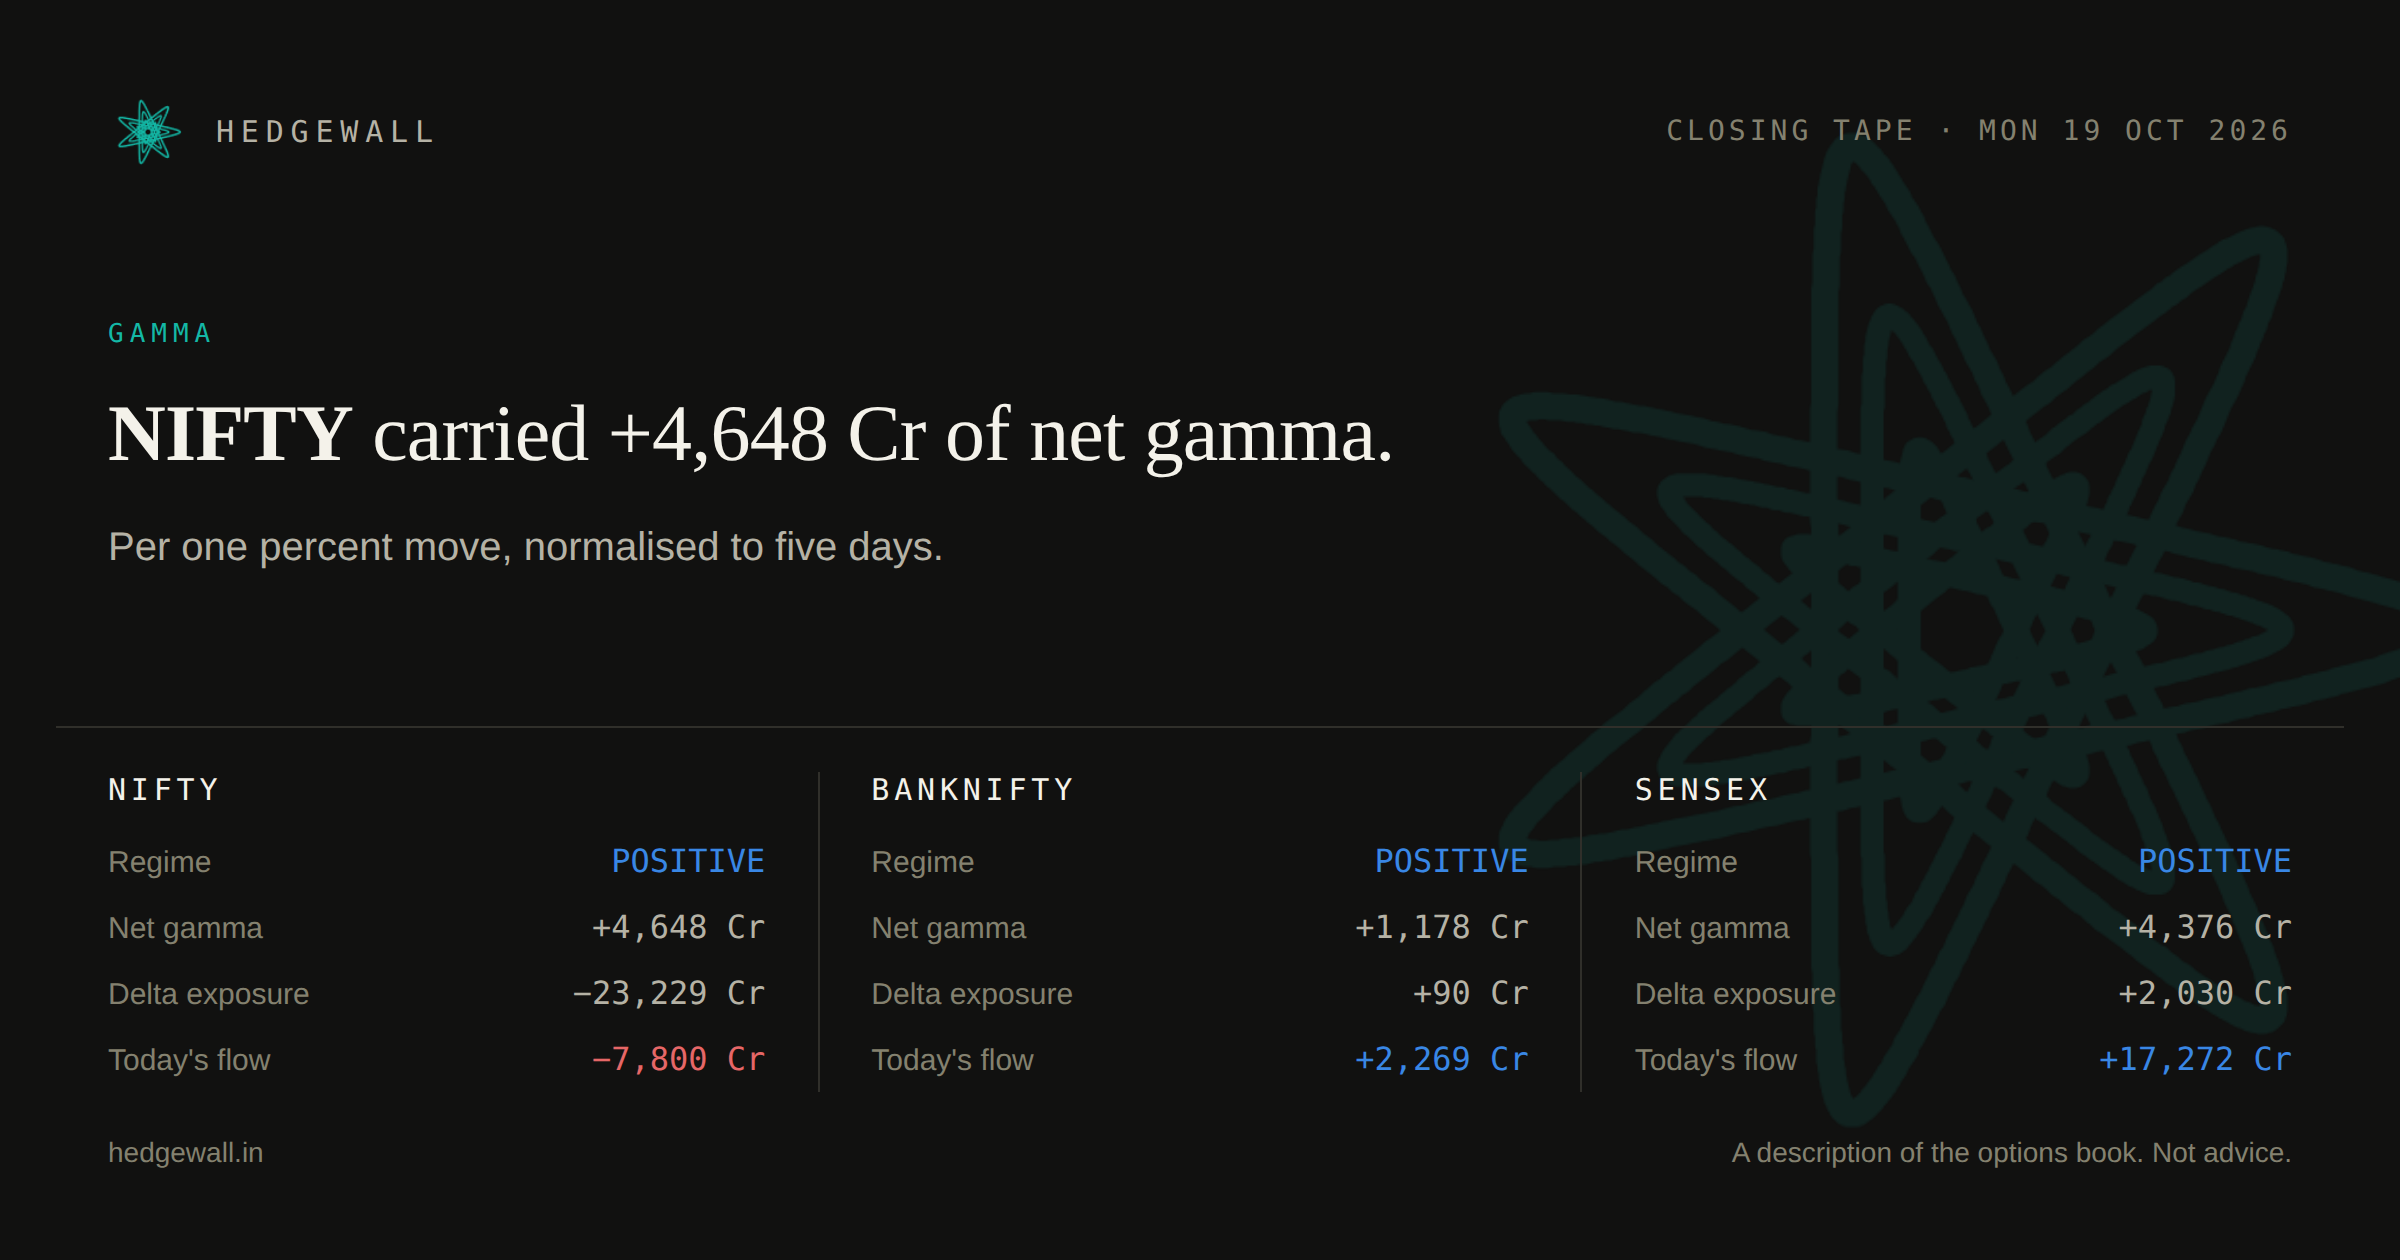
NIFTY closed 0.02 percent over its gamma flip, in a positive-gamma regime.
NIFTY22,888.95-0.966%
positive gamma · expiry day
GEX +4,648 Cr · Delta -23,229 Cr · Flow -7,800 Cr
BANKNIFTY55,488.10-0.233%
positive gamma
GEX +1,178 Cr · Delta +90 Cr · Flow +2,269 Cr
SENSEX73,852.90-0.917%
positive gamma
GEX +4,376 Cr · Delta +2,030 Cr · Flow +17,272 Cr
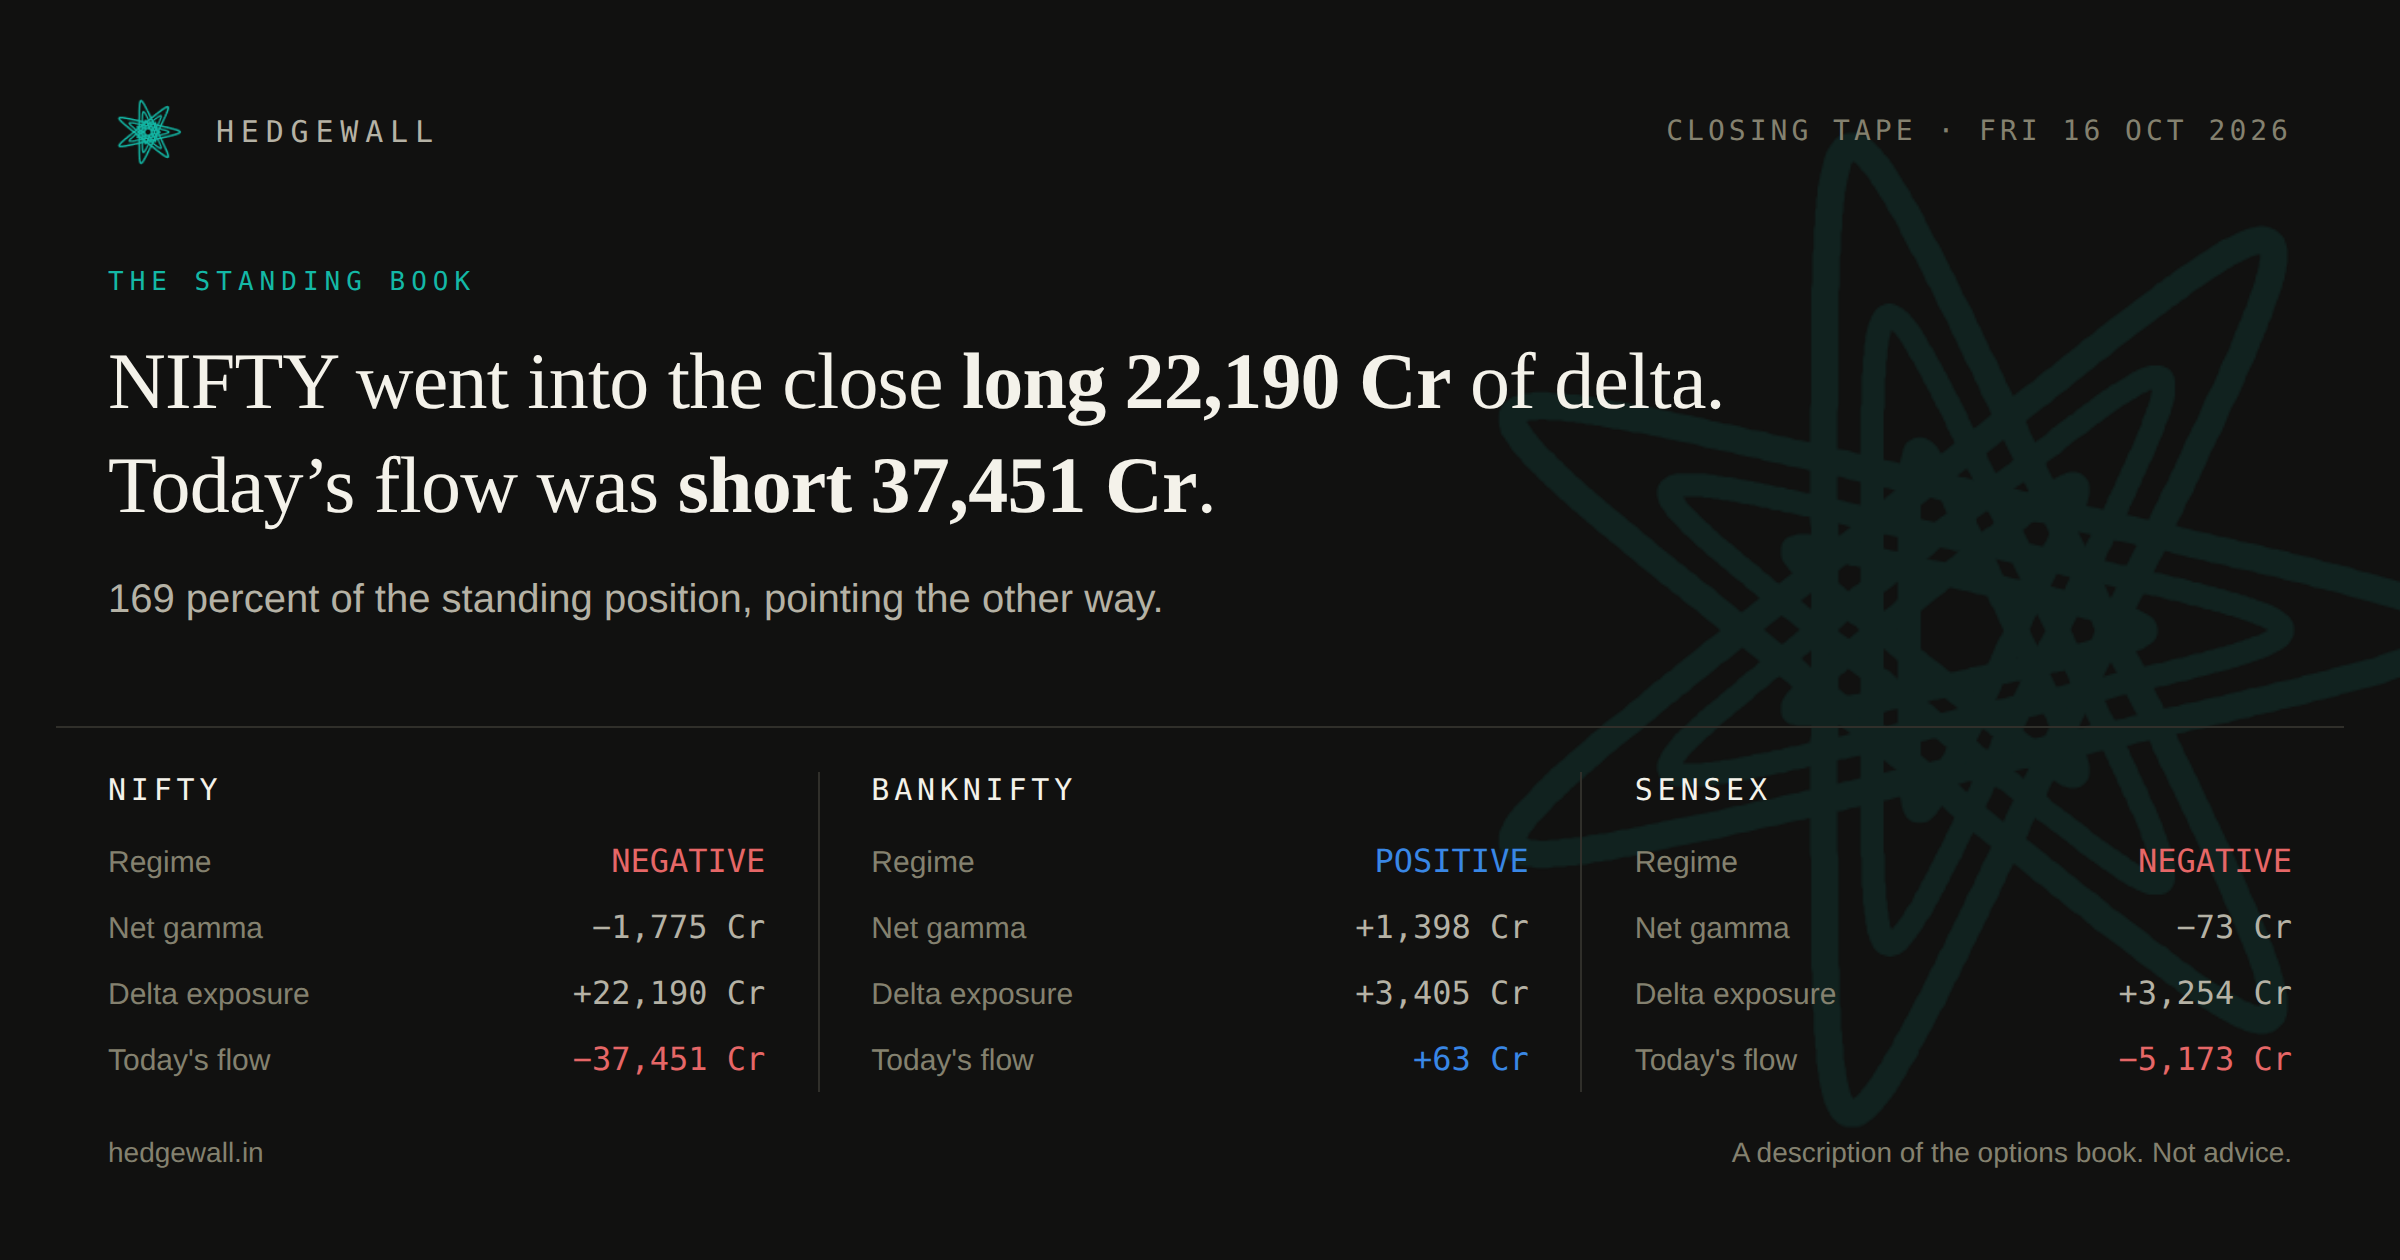
SENSEX closed 0.01 percent under its gamma flip, in a negative-gamma regime.
NIFTY23,146.15+0.486%
negative gamma
GEX -1,775 Cr · Delta +22,190 Cr · Flow -37,451 Cr
BANKNIFTY55,844.00-0.183%
positive gamma
GEX +1,398 Cr · Delta +3,405 Cr · Flow +63 Cr
SENSEX74,729.27+0.421%
negative gamma
GEX -73 Cr · Delta +3,254 Cr · Flow -5,173 Cr
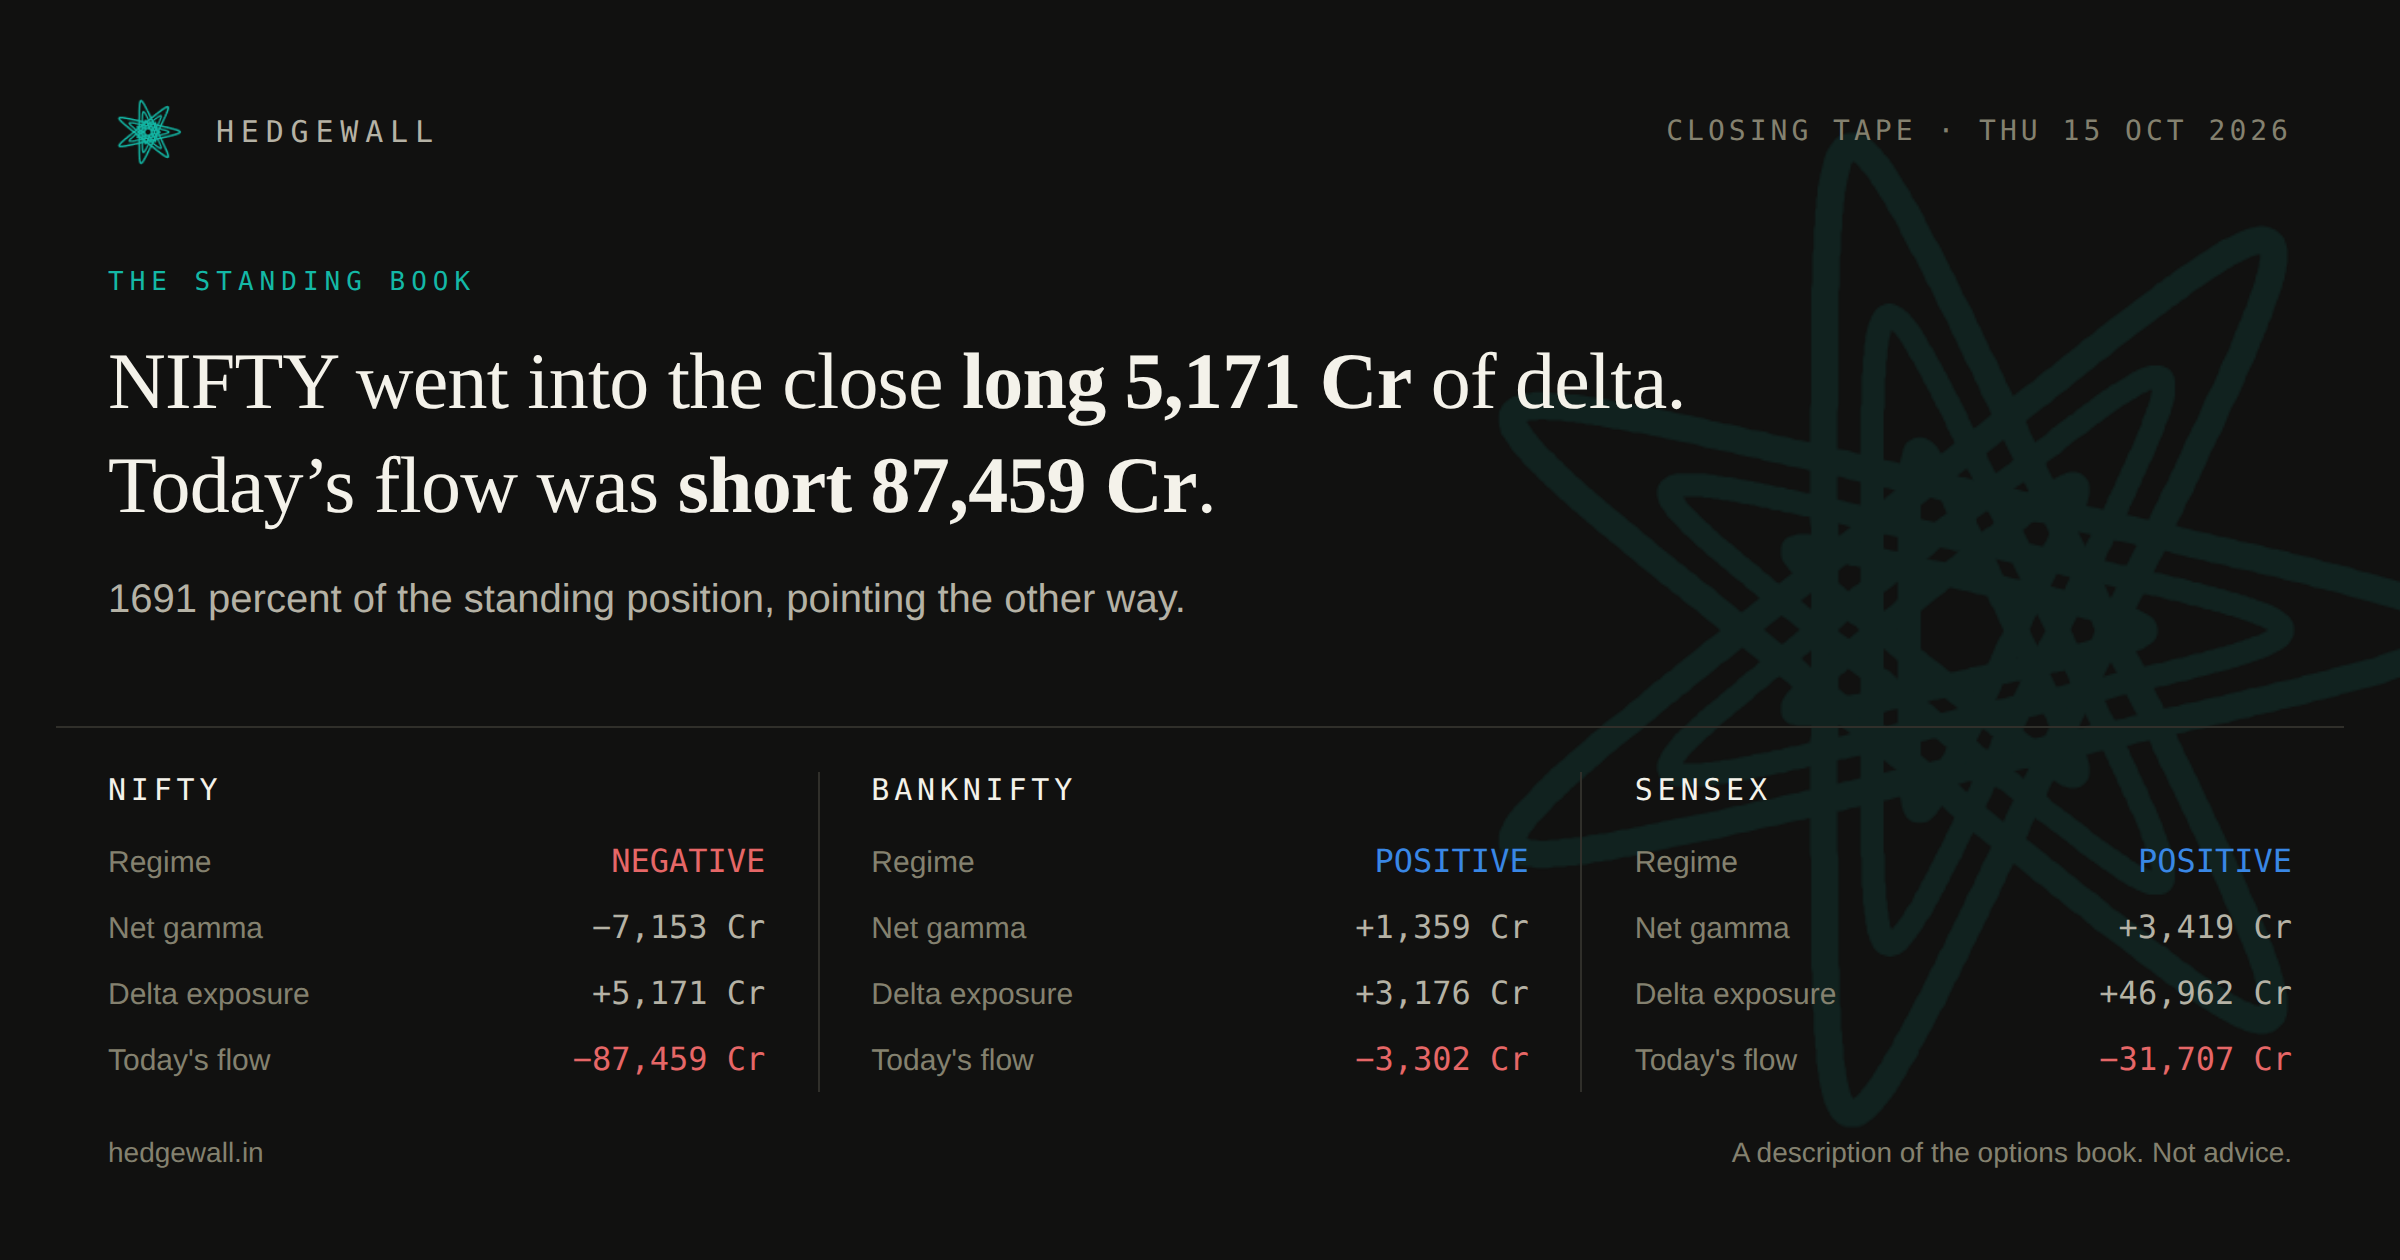
SENSEX closed 0.05 percent over its gamma flip, in a positive-gamma regime.
NIFTY22,997.35+1.307%
negative gamma
GEX -7,153 Cr · Delta +5,171 Cr · Flow -87,459 Cr
BANKNIFTY55,810.50+0.916%
positive gamma
GEX +1,359 Cr · Delta +3,176 Cr · Flow -3,302 Cr
SENSEX74,315.61+1.907%
positive gamma · expiry day
GEX +3,419 Cr · Delta +46,962 Cr · Flow -31,707 Cr
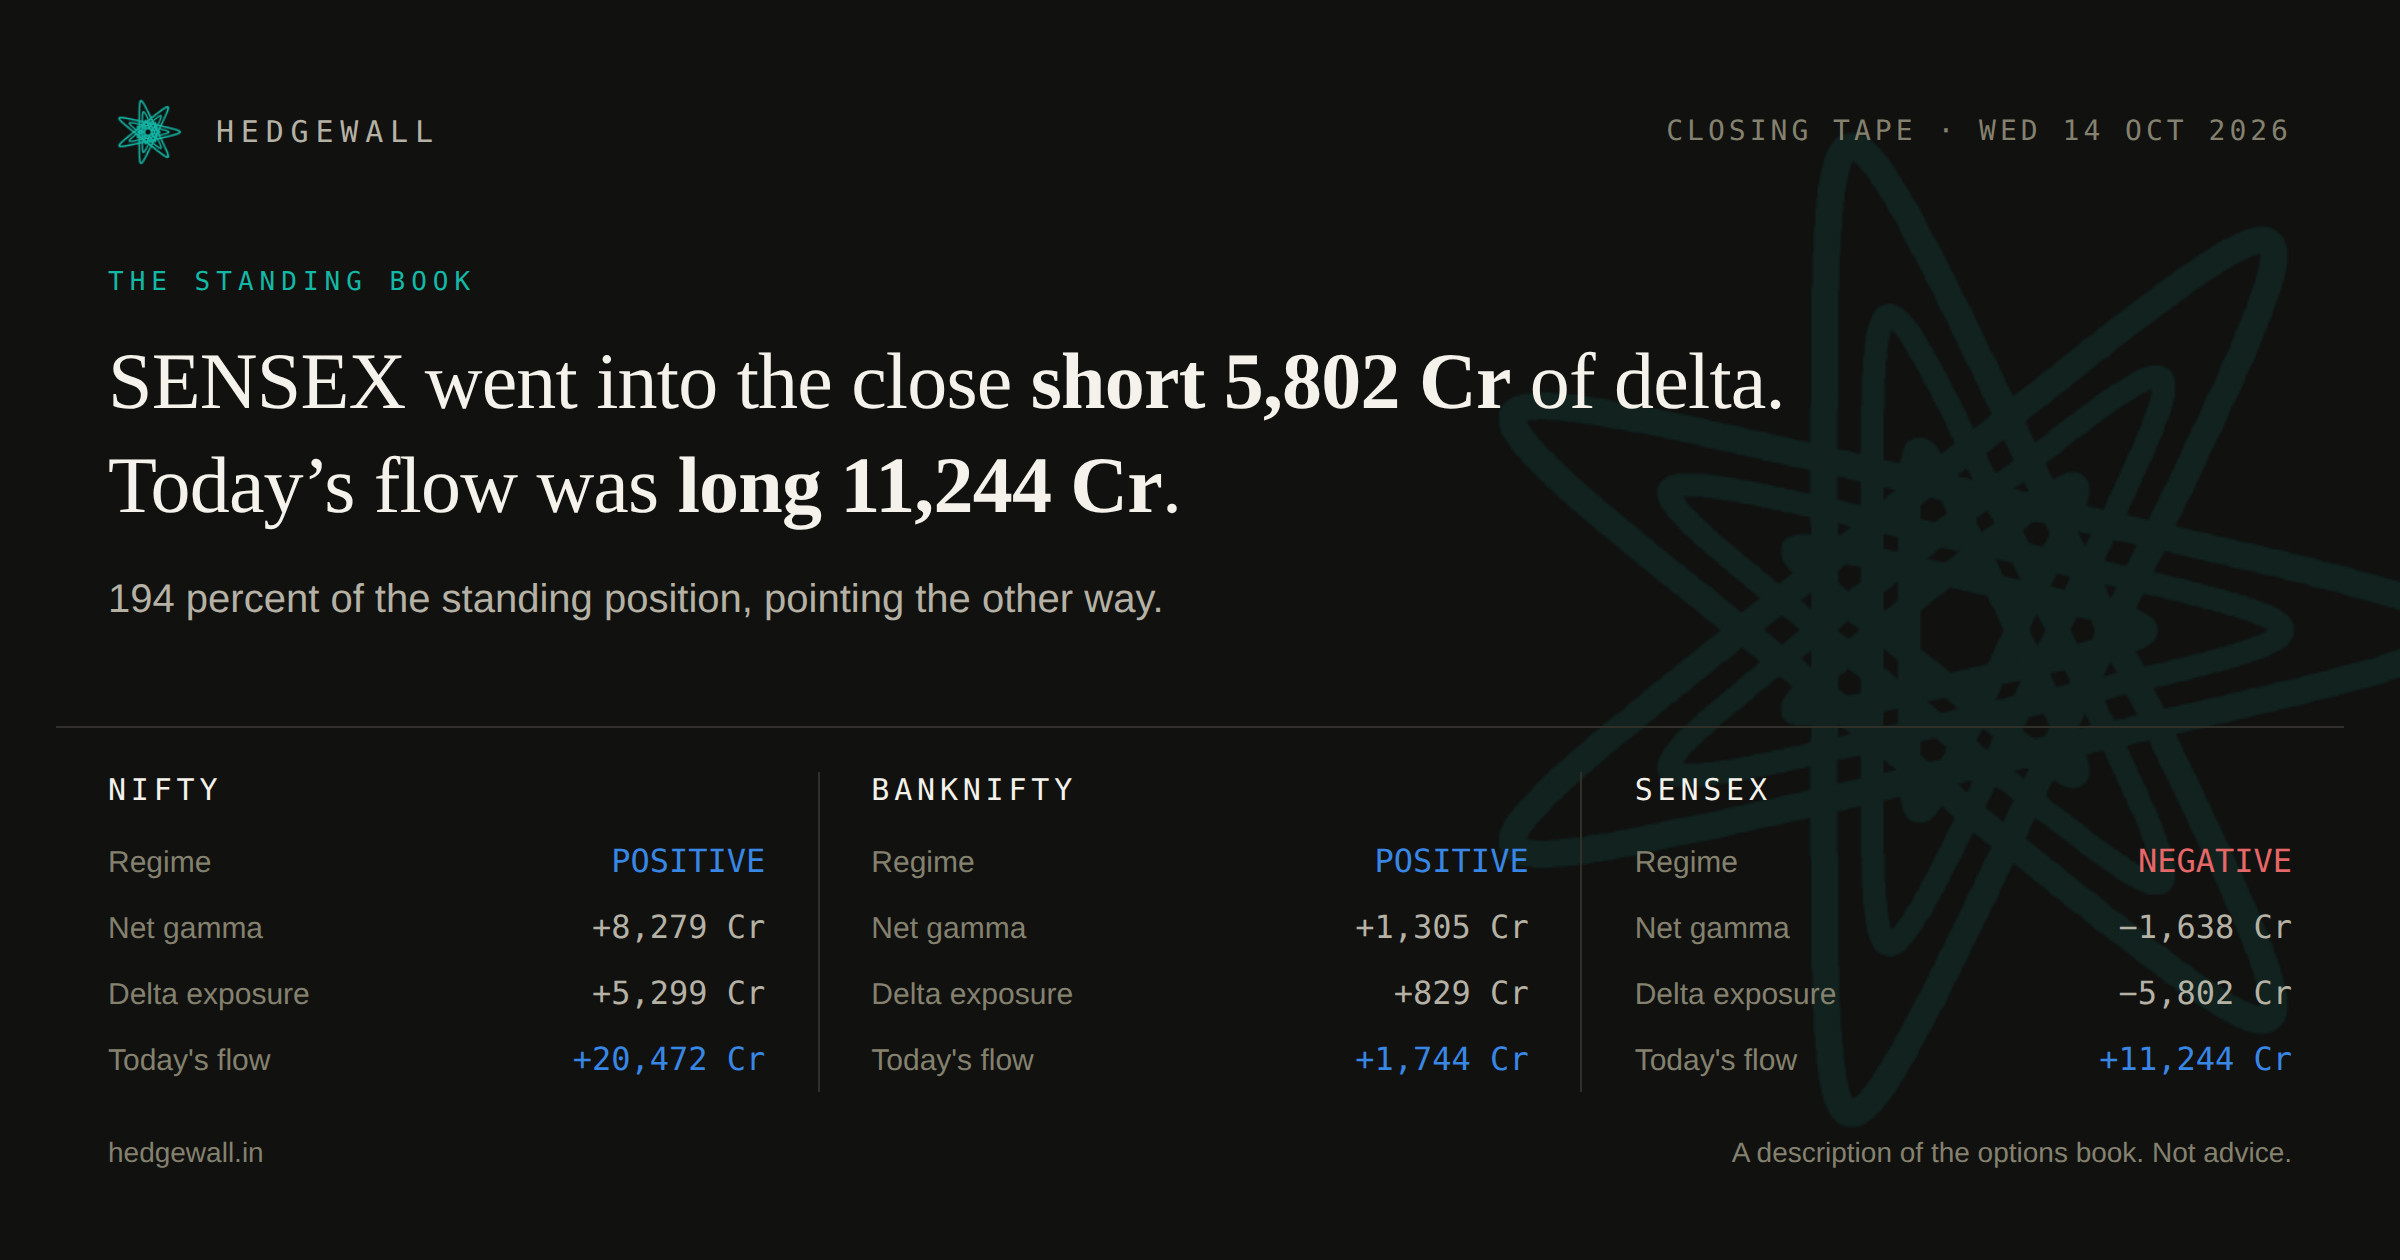
SENSEX closed 0.07 percent under its gamma flip, in a negative-gamma regime.
NIFTY22,622.70-0.323%
positive gamma
GEX +8,279 Cr · Delta +5,299 Cr · Flow +20,472 Cr
BANKNIFTY55,316.00-0.239%
positive gamma
GEX +1,305 Cr · Delta +829 Cr · Flow +1,744 Cr
SENSEX72,781.89-0.197%
negative gamma
GEX -1,638 Cr · Delta -5,802 Cr · Flow +11,244 Cr
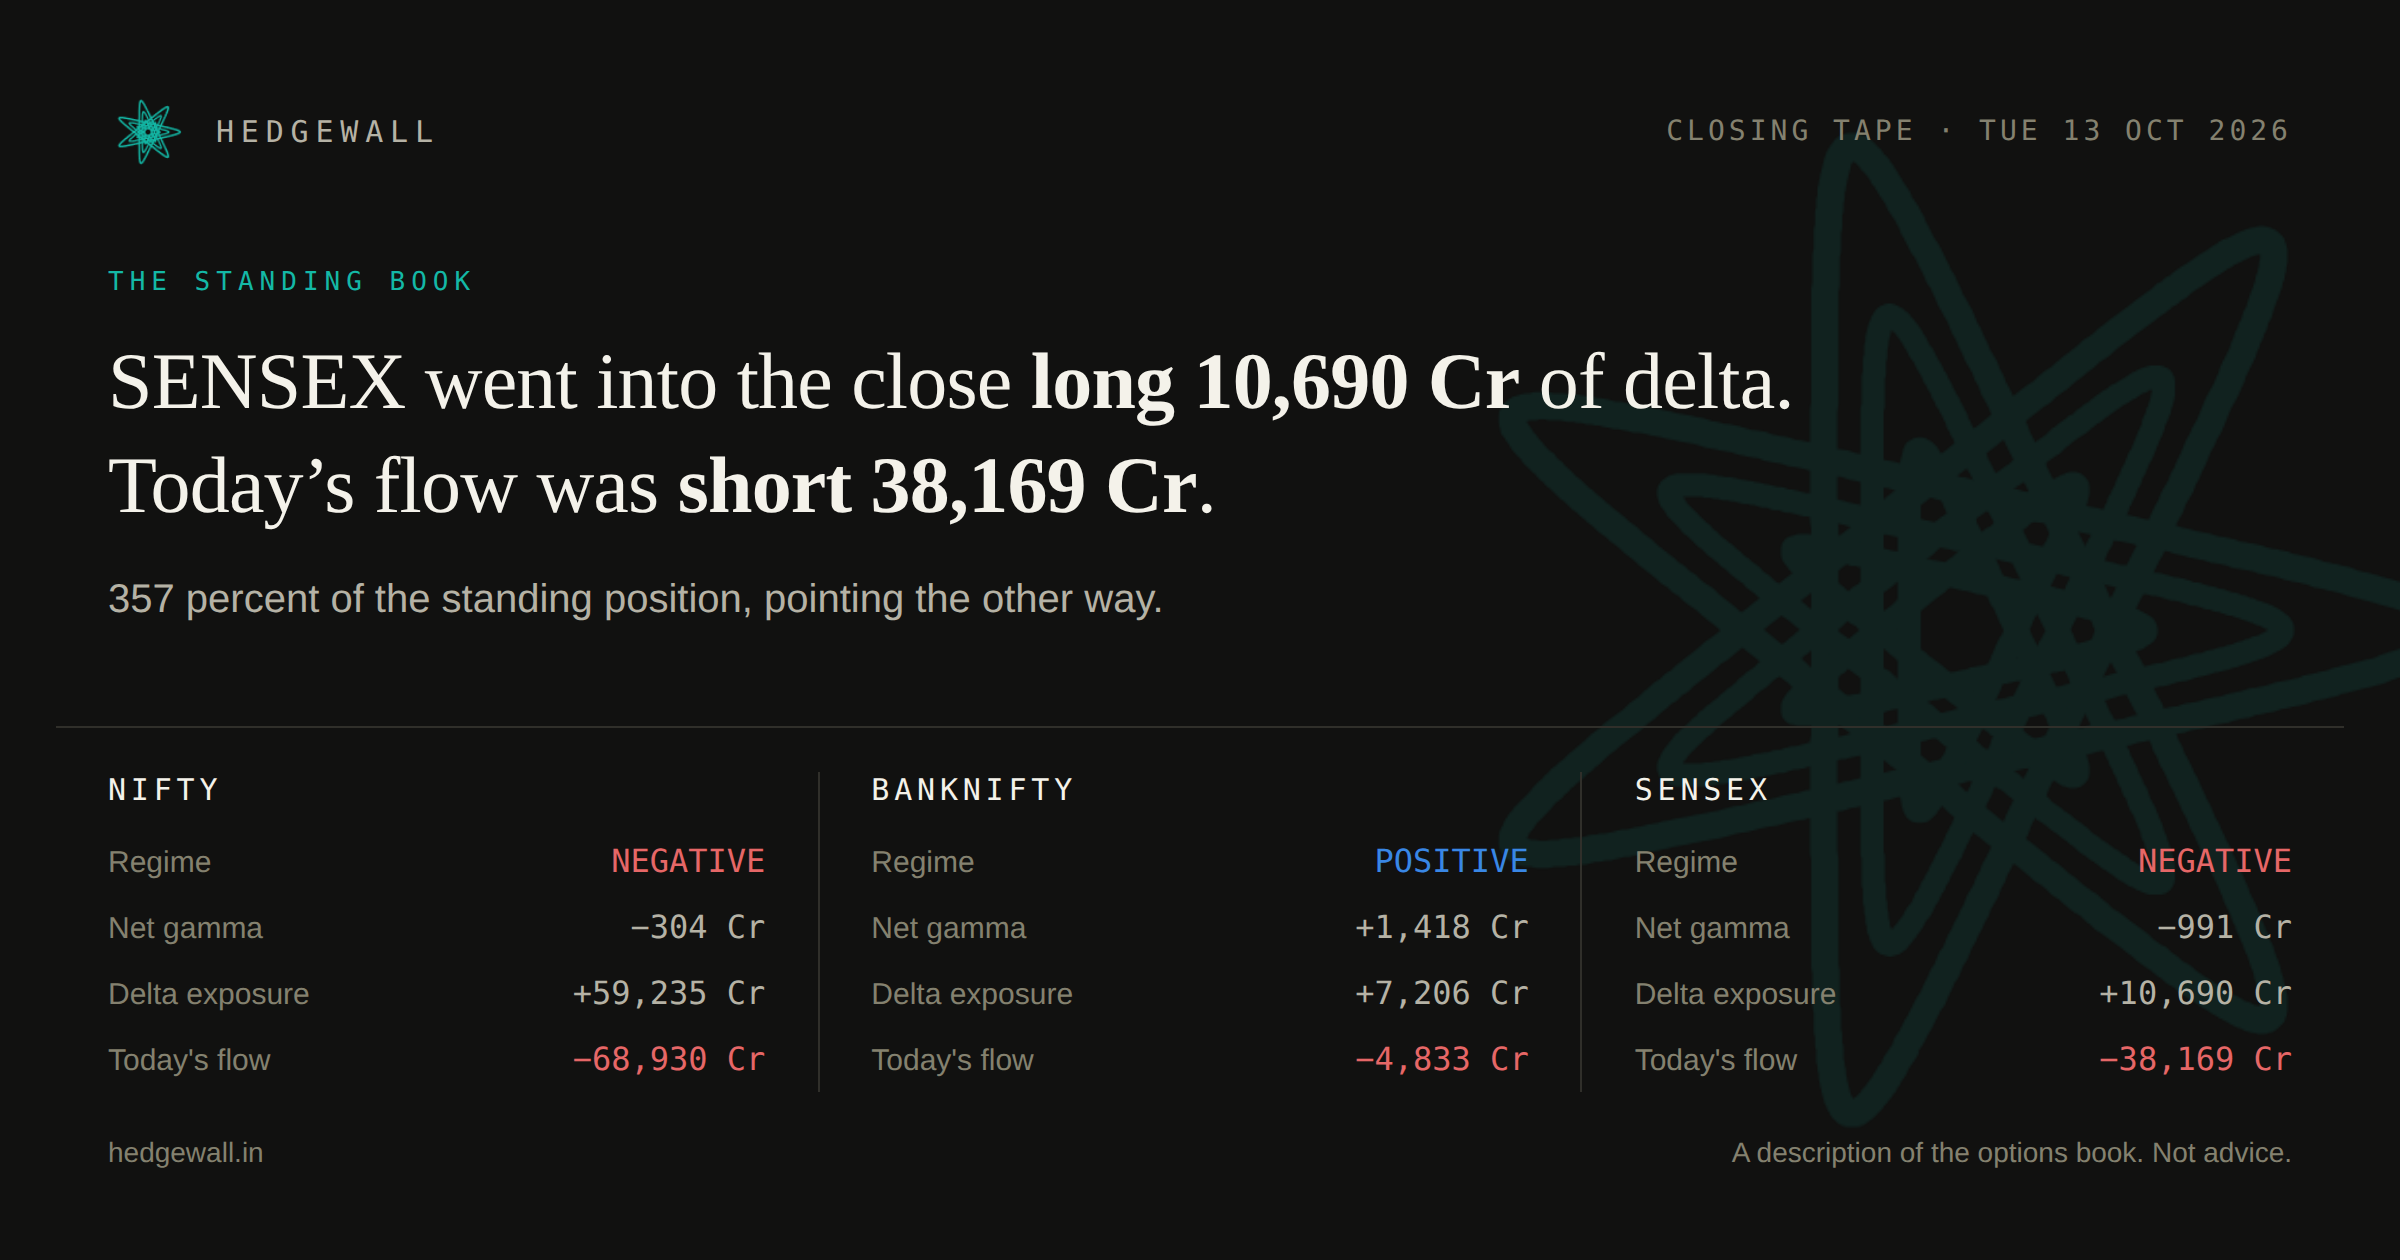
NIFTY sat on its gamma flip, in a negative-gamma regime.
NIFTY22,721.95+1.767%
negative gamma · expiry day
GEX -304 Cr · Delta +59,235 Cr · Flow -68,930 Cr
BANKNIFTY55,481.05+0.794%
positive gamma
GEX +1,418 Cr · Delta +7,206 Cr · Flow -4,833 Cr
SENSEX73,033.78+1.163%
negative gamma
GEX -991 Cr · Delta +10,690 Cr · Flow -38,169 Cr
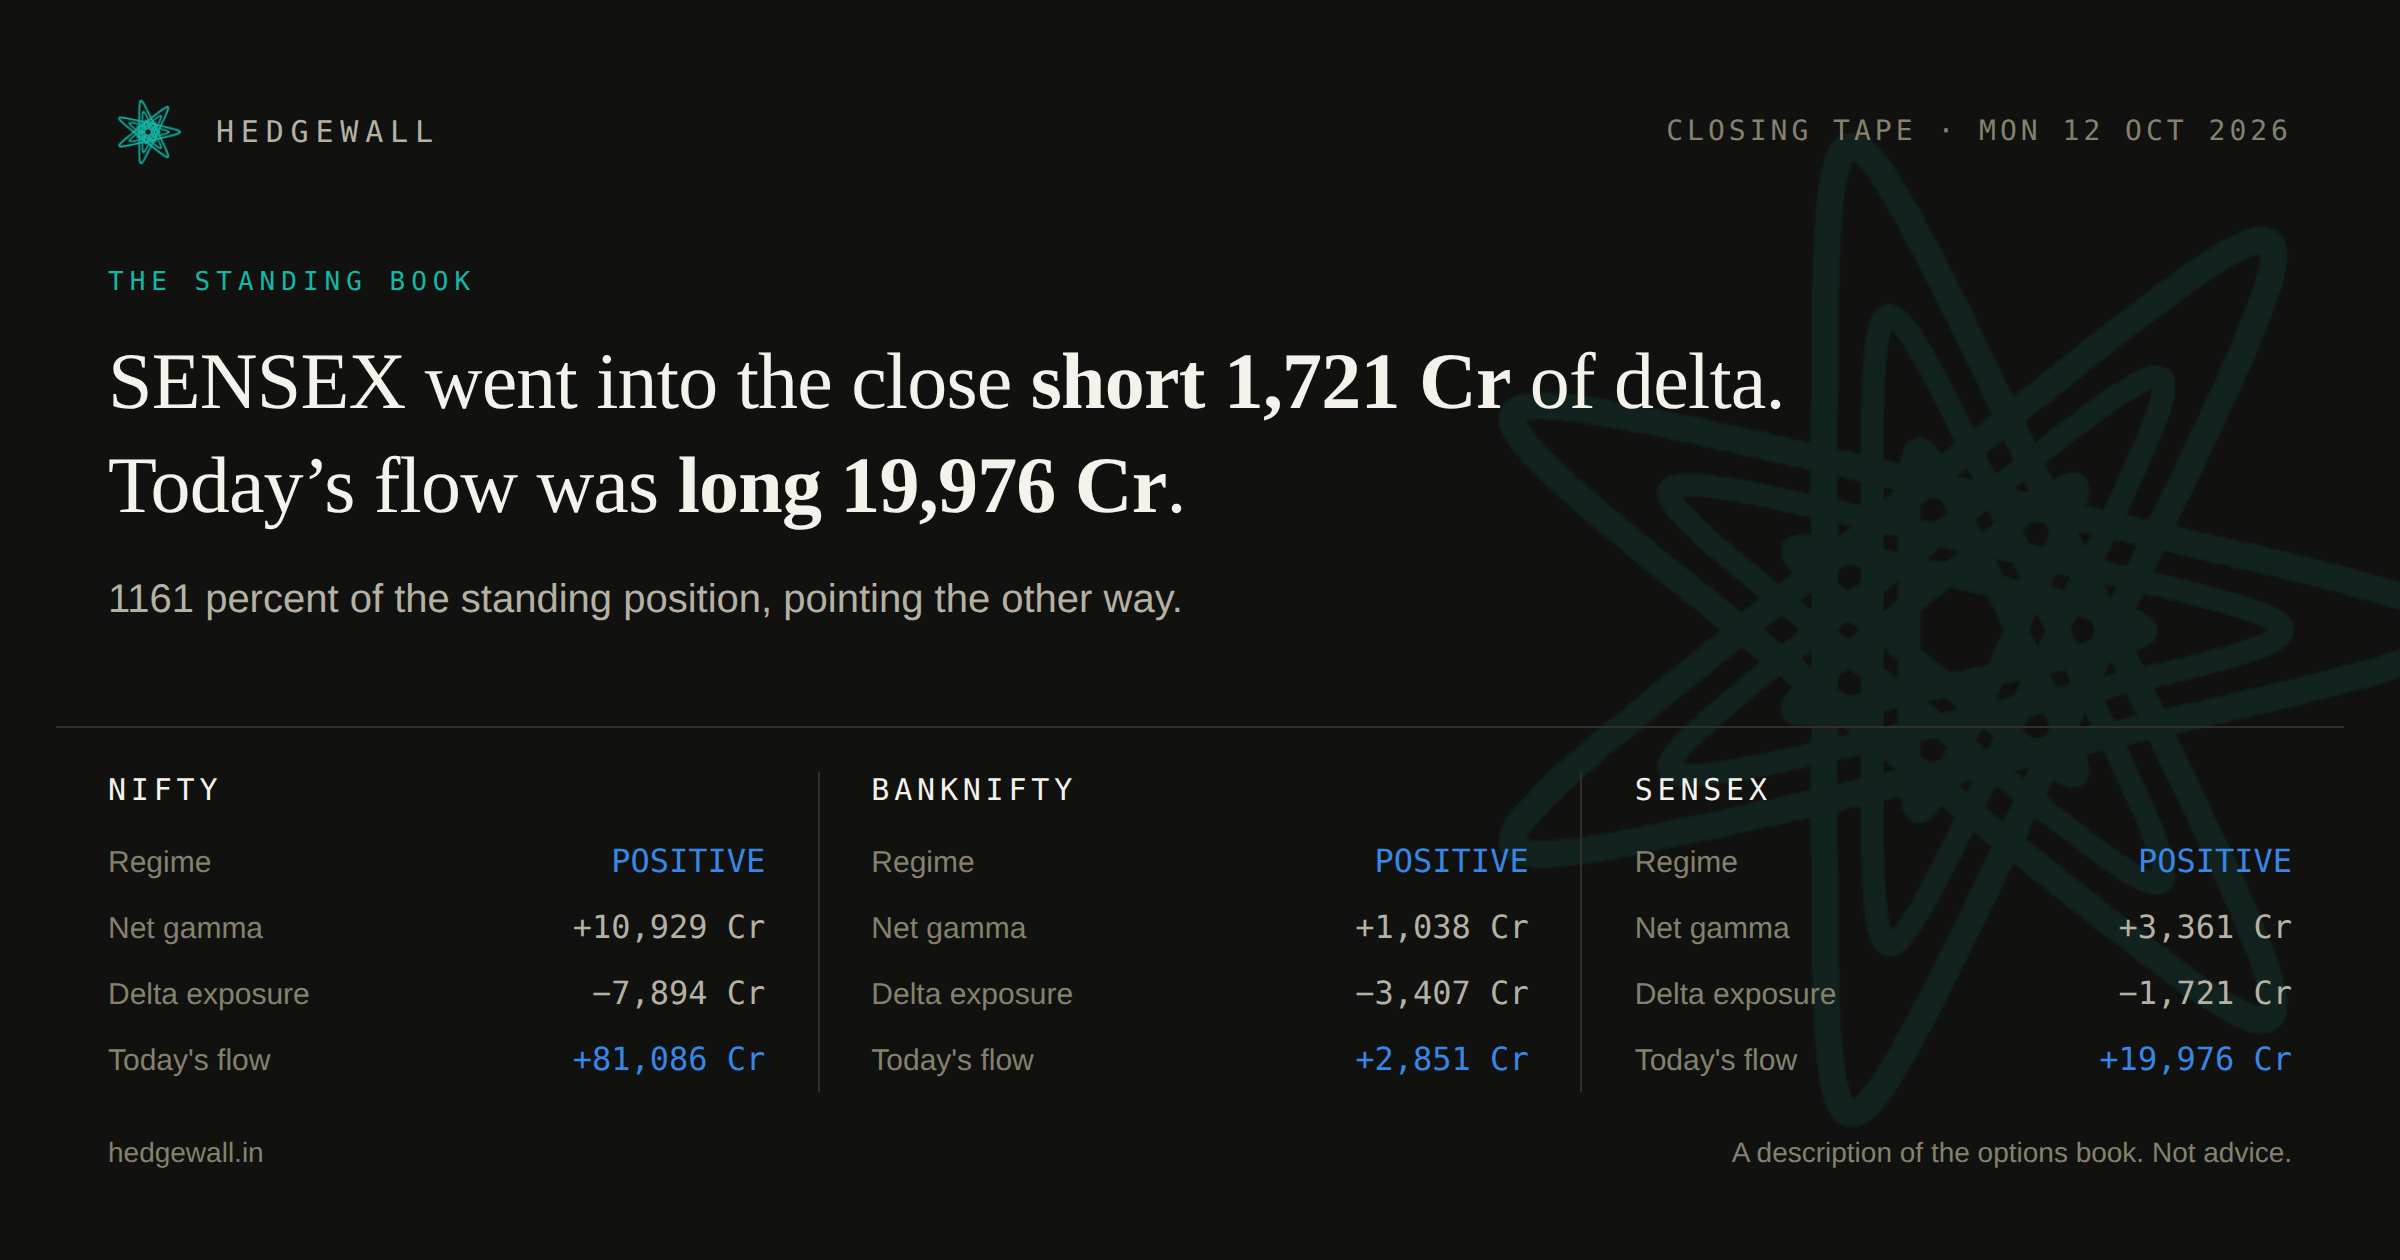
NIFTY closed 0.30 percent over its gamma flip, in a positive-gamma regime.
NIFTY22,363.35-1.206%
positive gamma
GEX +10,929 Cr · Delta -7,894 Cr · Flow +81,086 Cr
BANKNIFTY54,918.00-0.668%
positive gamma
GEX +1,038 Cr · Delta -3,407 Cr · Flow +2,851 Cr
SENSEX71,924.68-1.190%
positive gamma
GEX +3,361 Cr · Delta -1,721 Cr · Flow +19,976 Cr
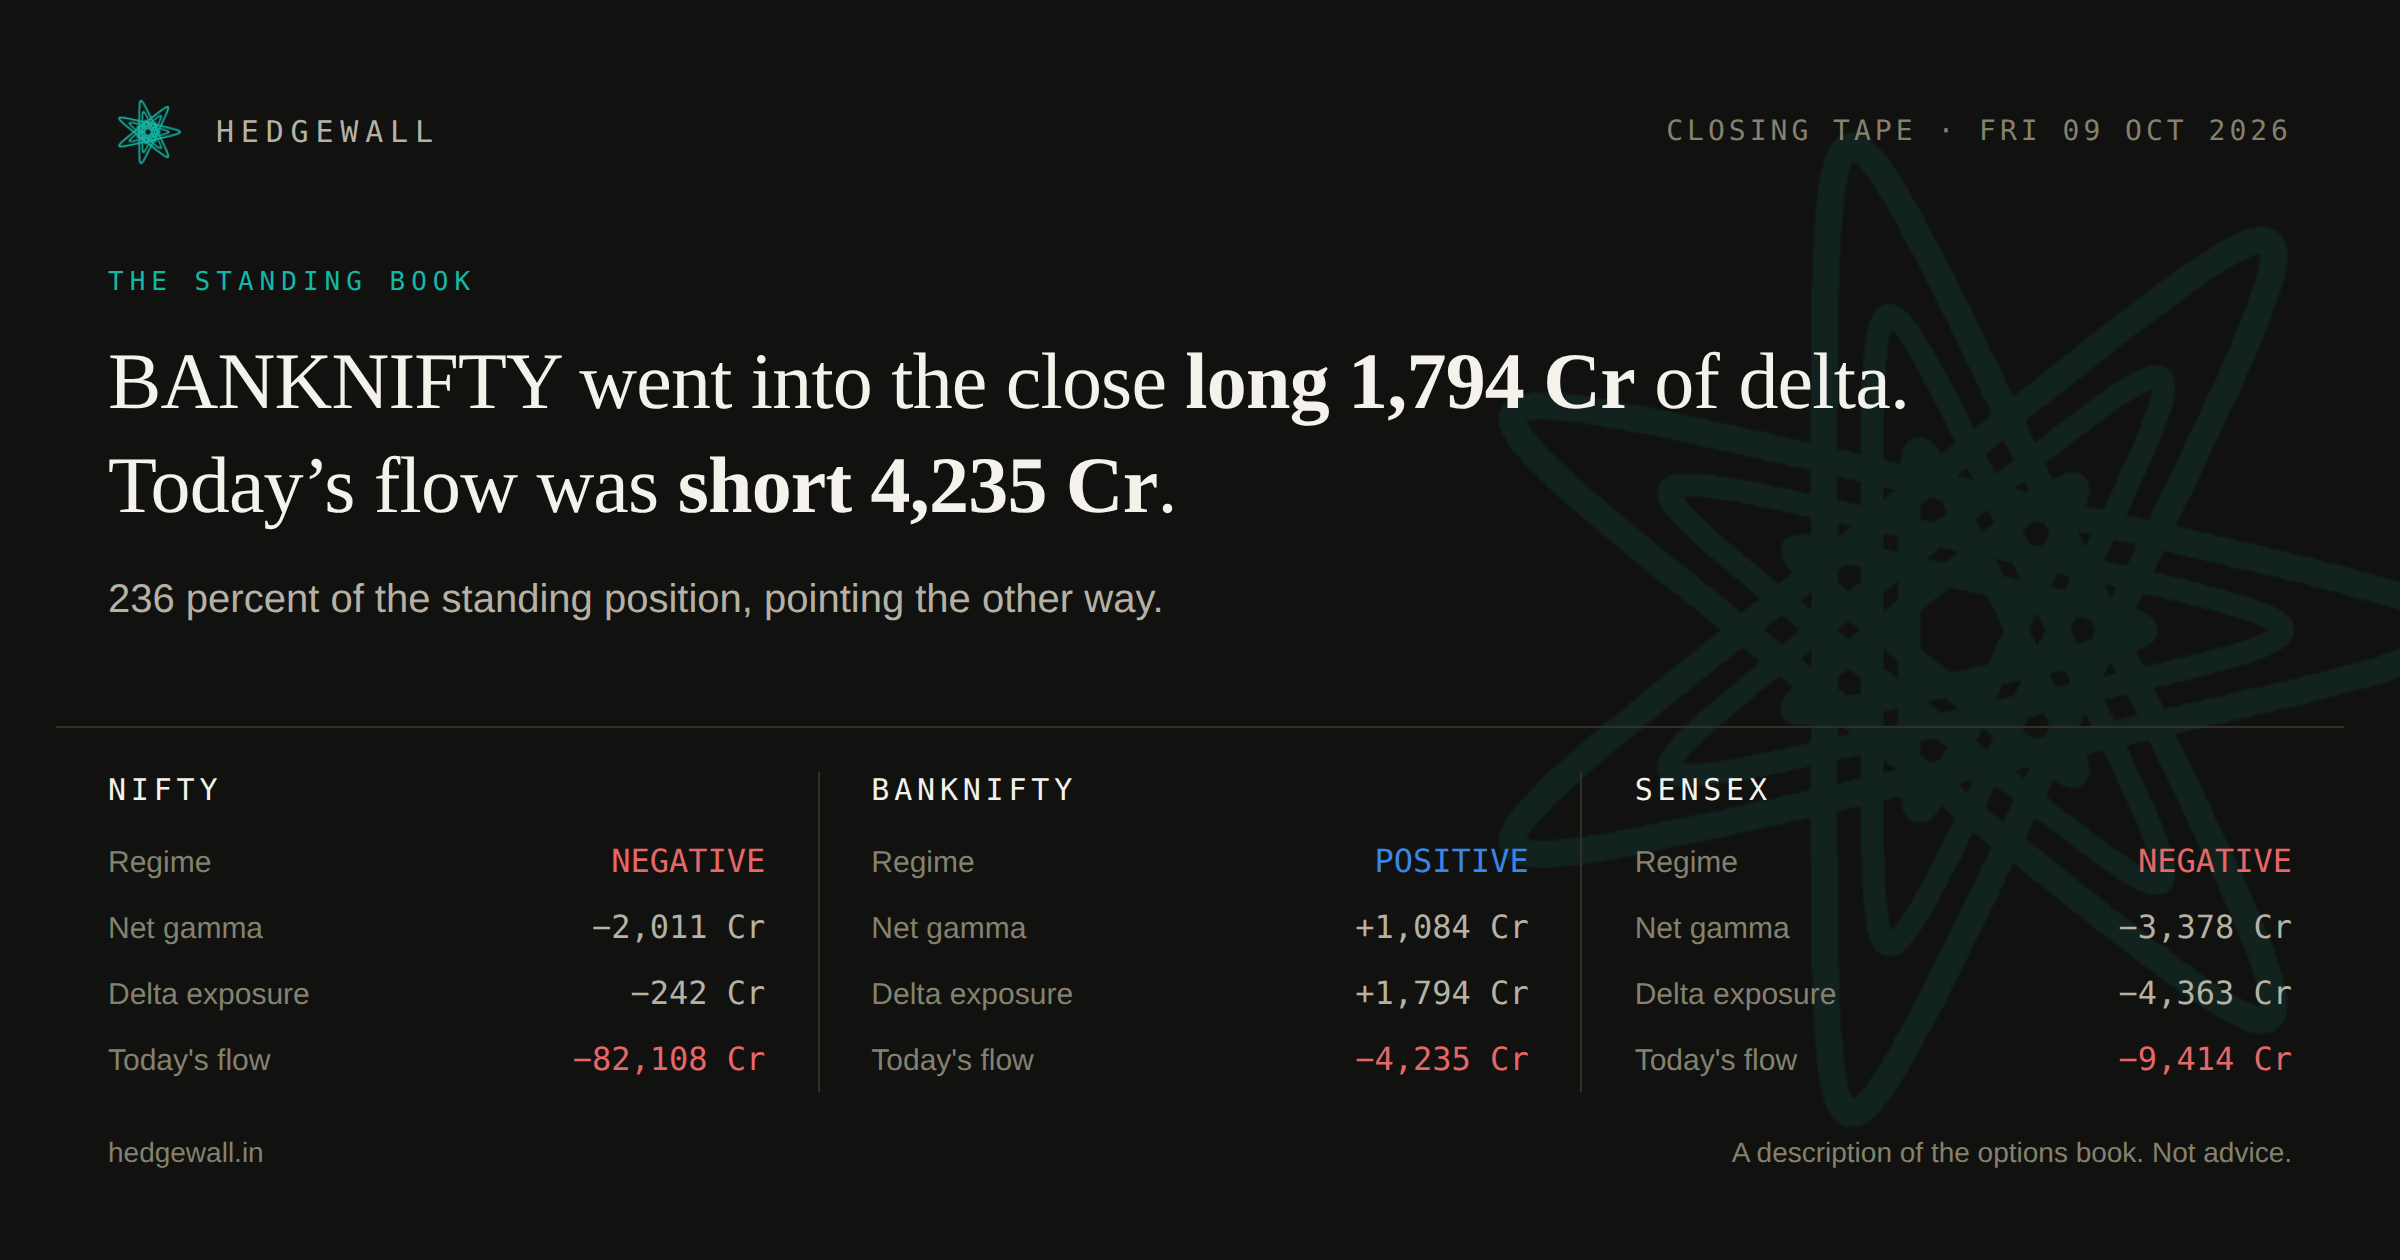
NIFTY closed 0.05 percent under its gamma flip, in a negative-gamma regime.
NIFTY22,520.45+0.866%
negative gamma
GEX -2,011 Cr · Delta -242 Cr · Flow -82,108 Cr
BANKNIFTY55,256.65+0.784%
positive gamma
GEX +1,084 Cr · Delta +1,794 Cr · Flow -4,235 Cr
SENSEX72,472.33+0.649%
negative gamma
GEX -3,378 Cr · Delta -4,363 Cr · Flow -9,414 Cr
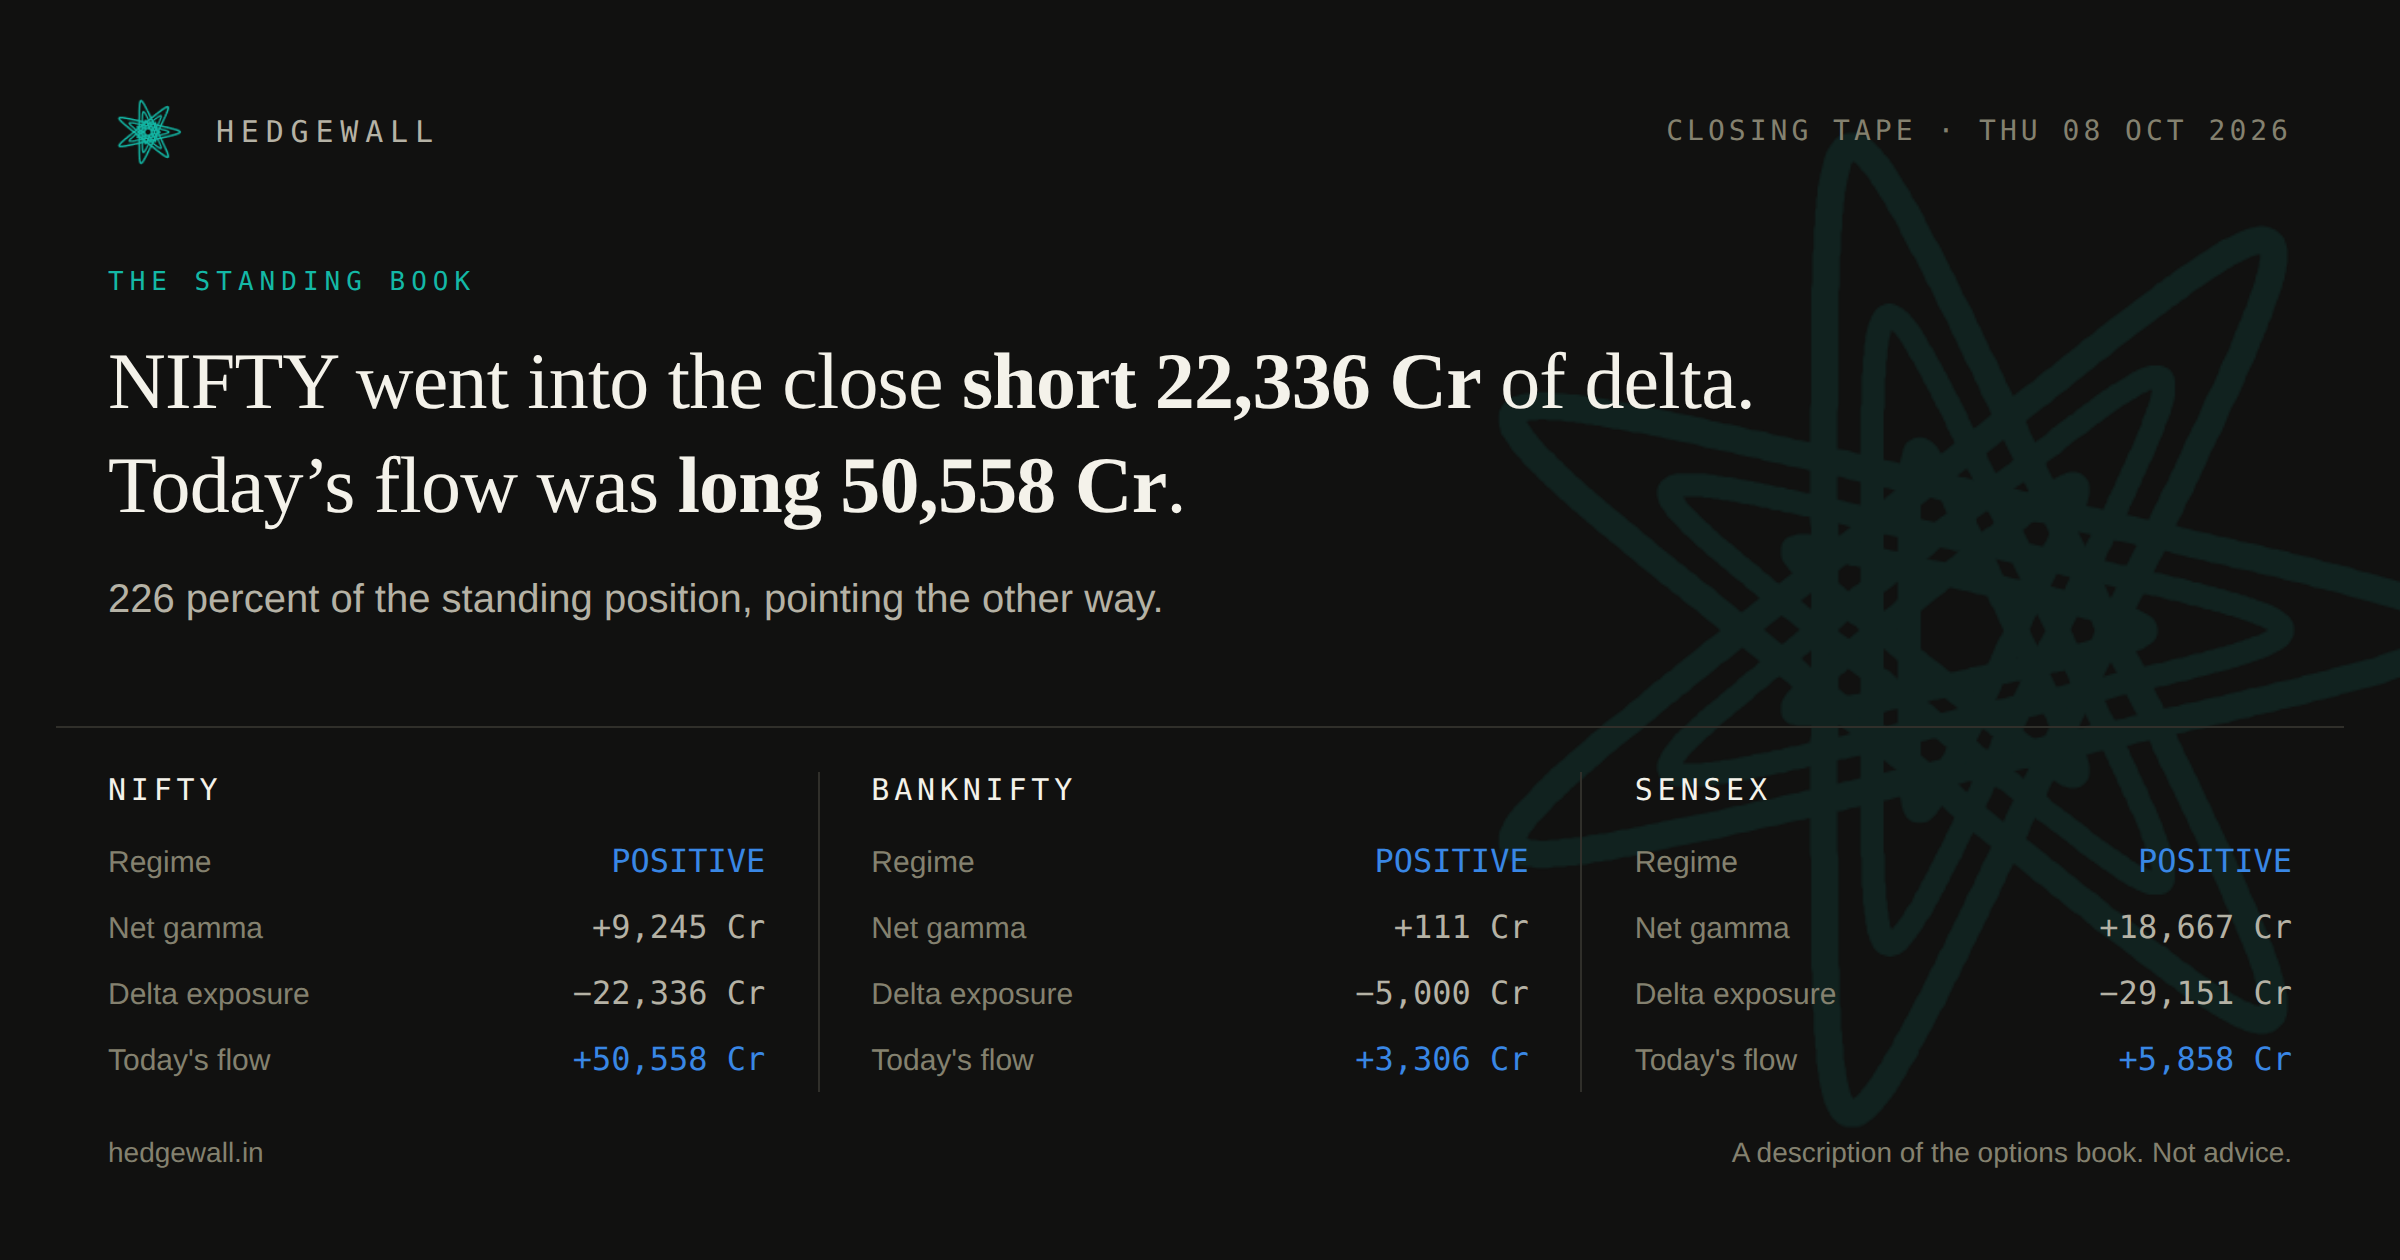
SENSEX closed 0.01 percent over its gamma flip, in a positive-gamma regime.
NIFTY22,231.80-1.304%
positive gamma
GEX +9,245 Cr · Delta -22,336 Cr · Flow +50,558 Cr
BANKNIFTY54,515.05-0.619%
positive gamma
GEX +111 Cr · Delta -5,000 Cr · Flow +3,306 Cr
SENSEX71,593.24-1.176%
positive gamma · expiry day
GEX +18,667 Cr · Delta -29,151 Cr · Flow +5,858 Cr
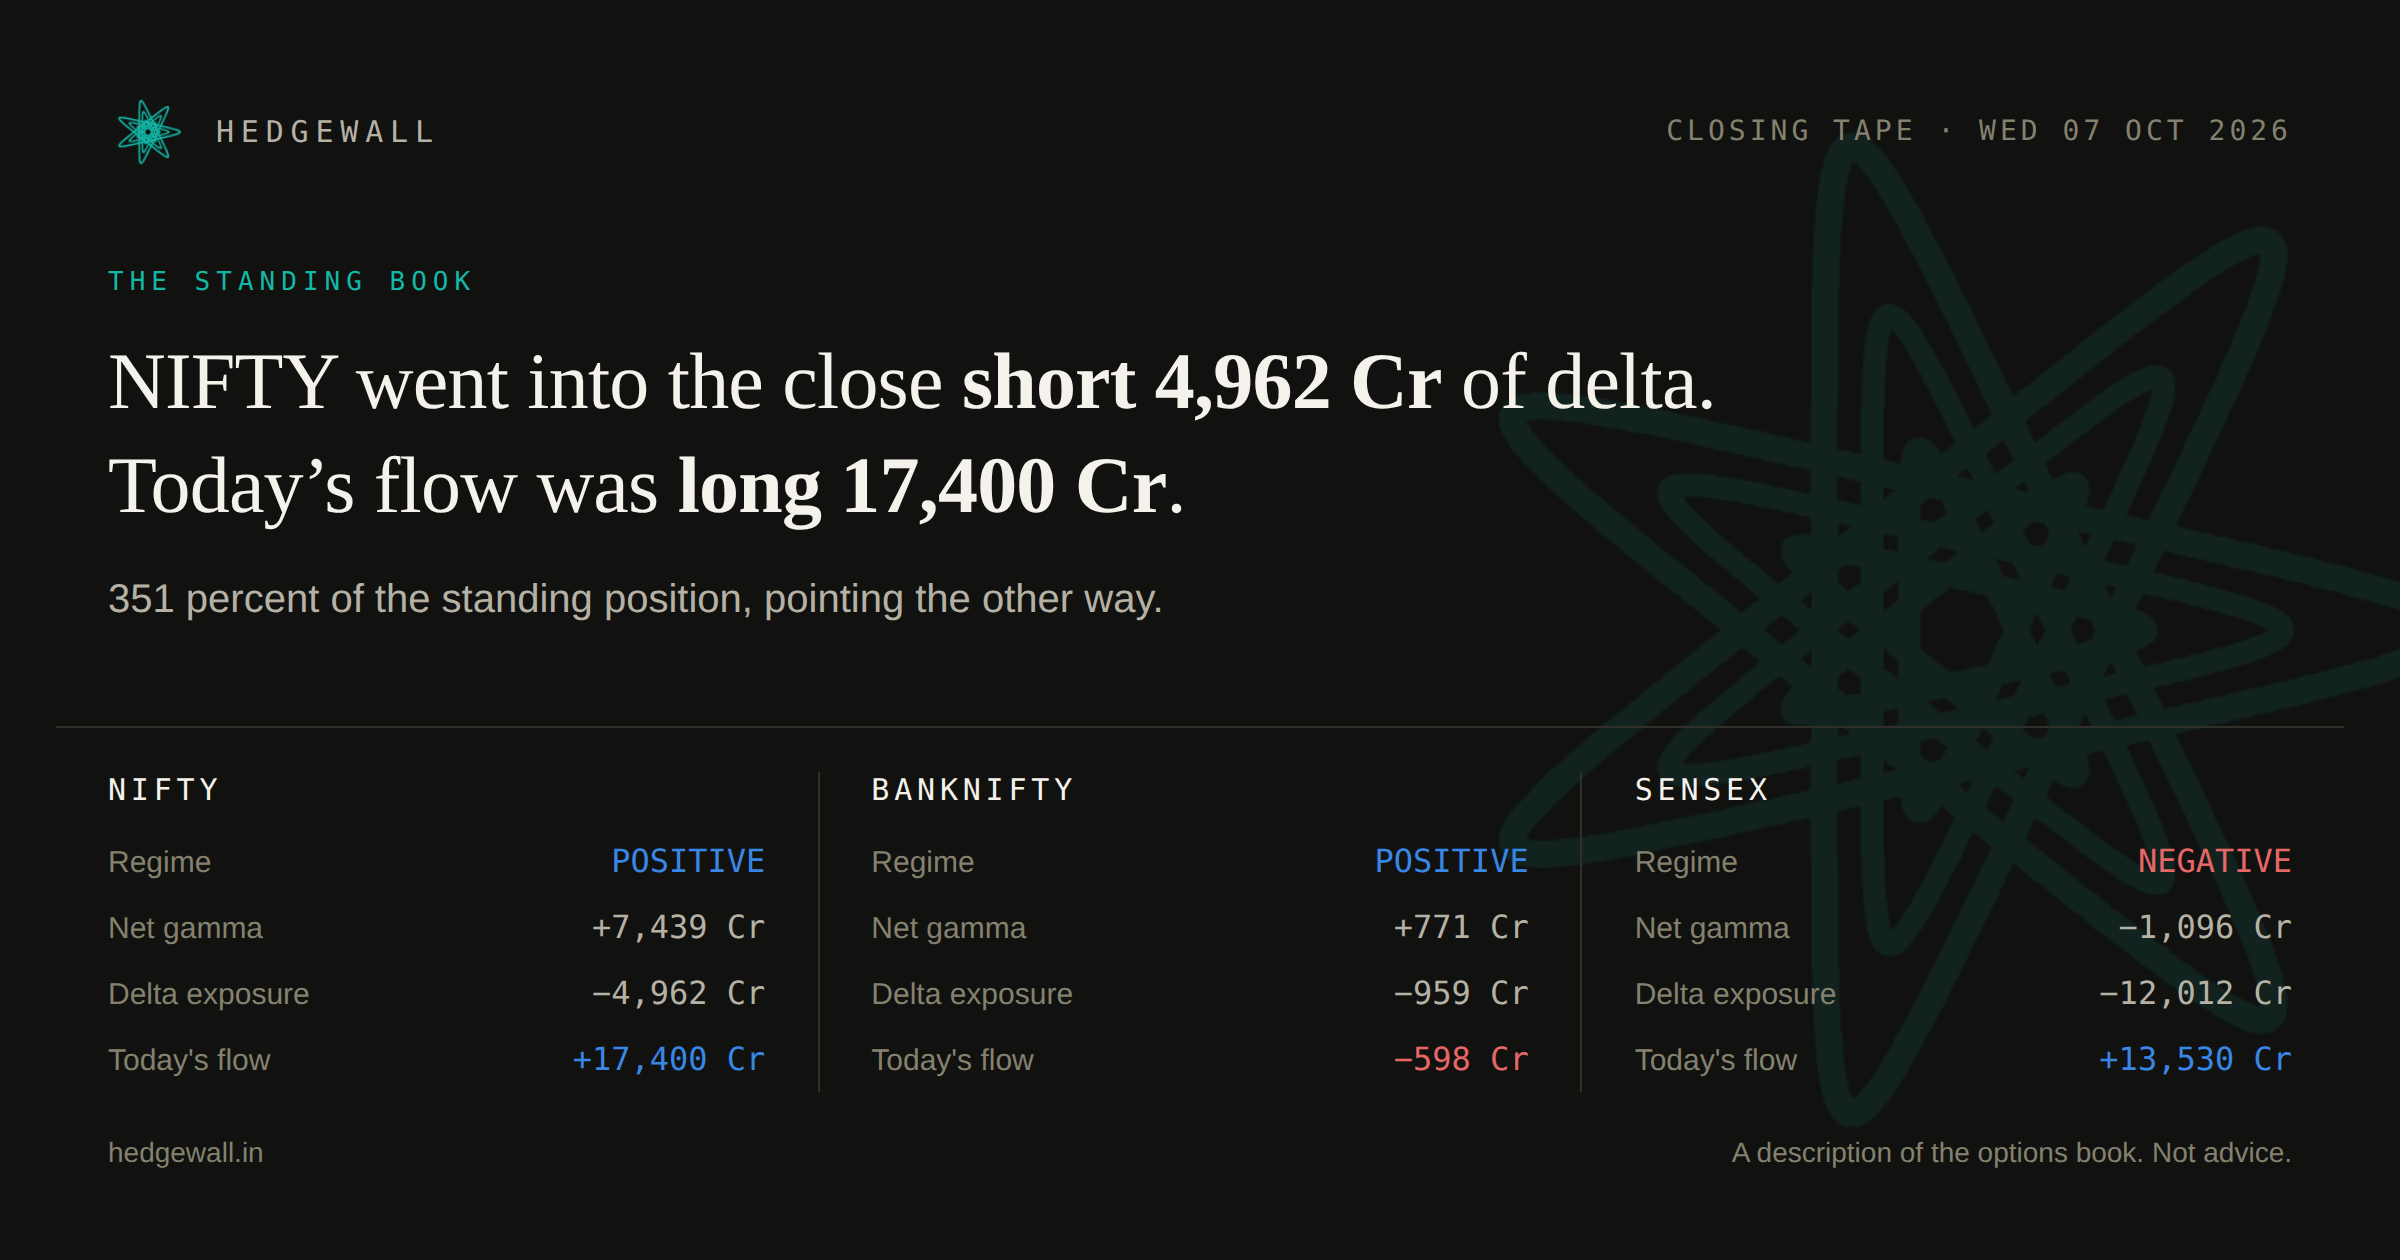
SENSEX closed 0.04 percent under its gamma flip, in a negative-gamma regime.
NIFTY22,603.05-0.189%
positive gamma
GEX +7,439 Cr · Delta -4,962 Cr · Flow +17,400 Cr
BANKNIFTY55,055.55+0.609%
positive gamma
GEX +771 Cr · Delta -959 Cr · Flow -598 Cr
SENSEX72,638.70-0.039%
negative gamma
GEX -1,096 Cr · Delta -12,012 Cr · Flow +13,530 Cr
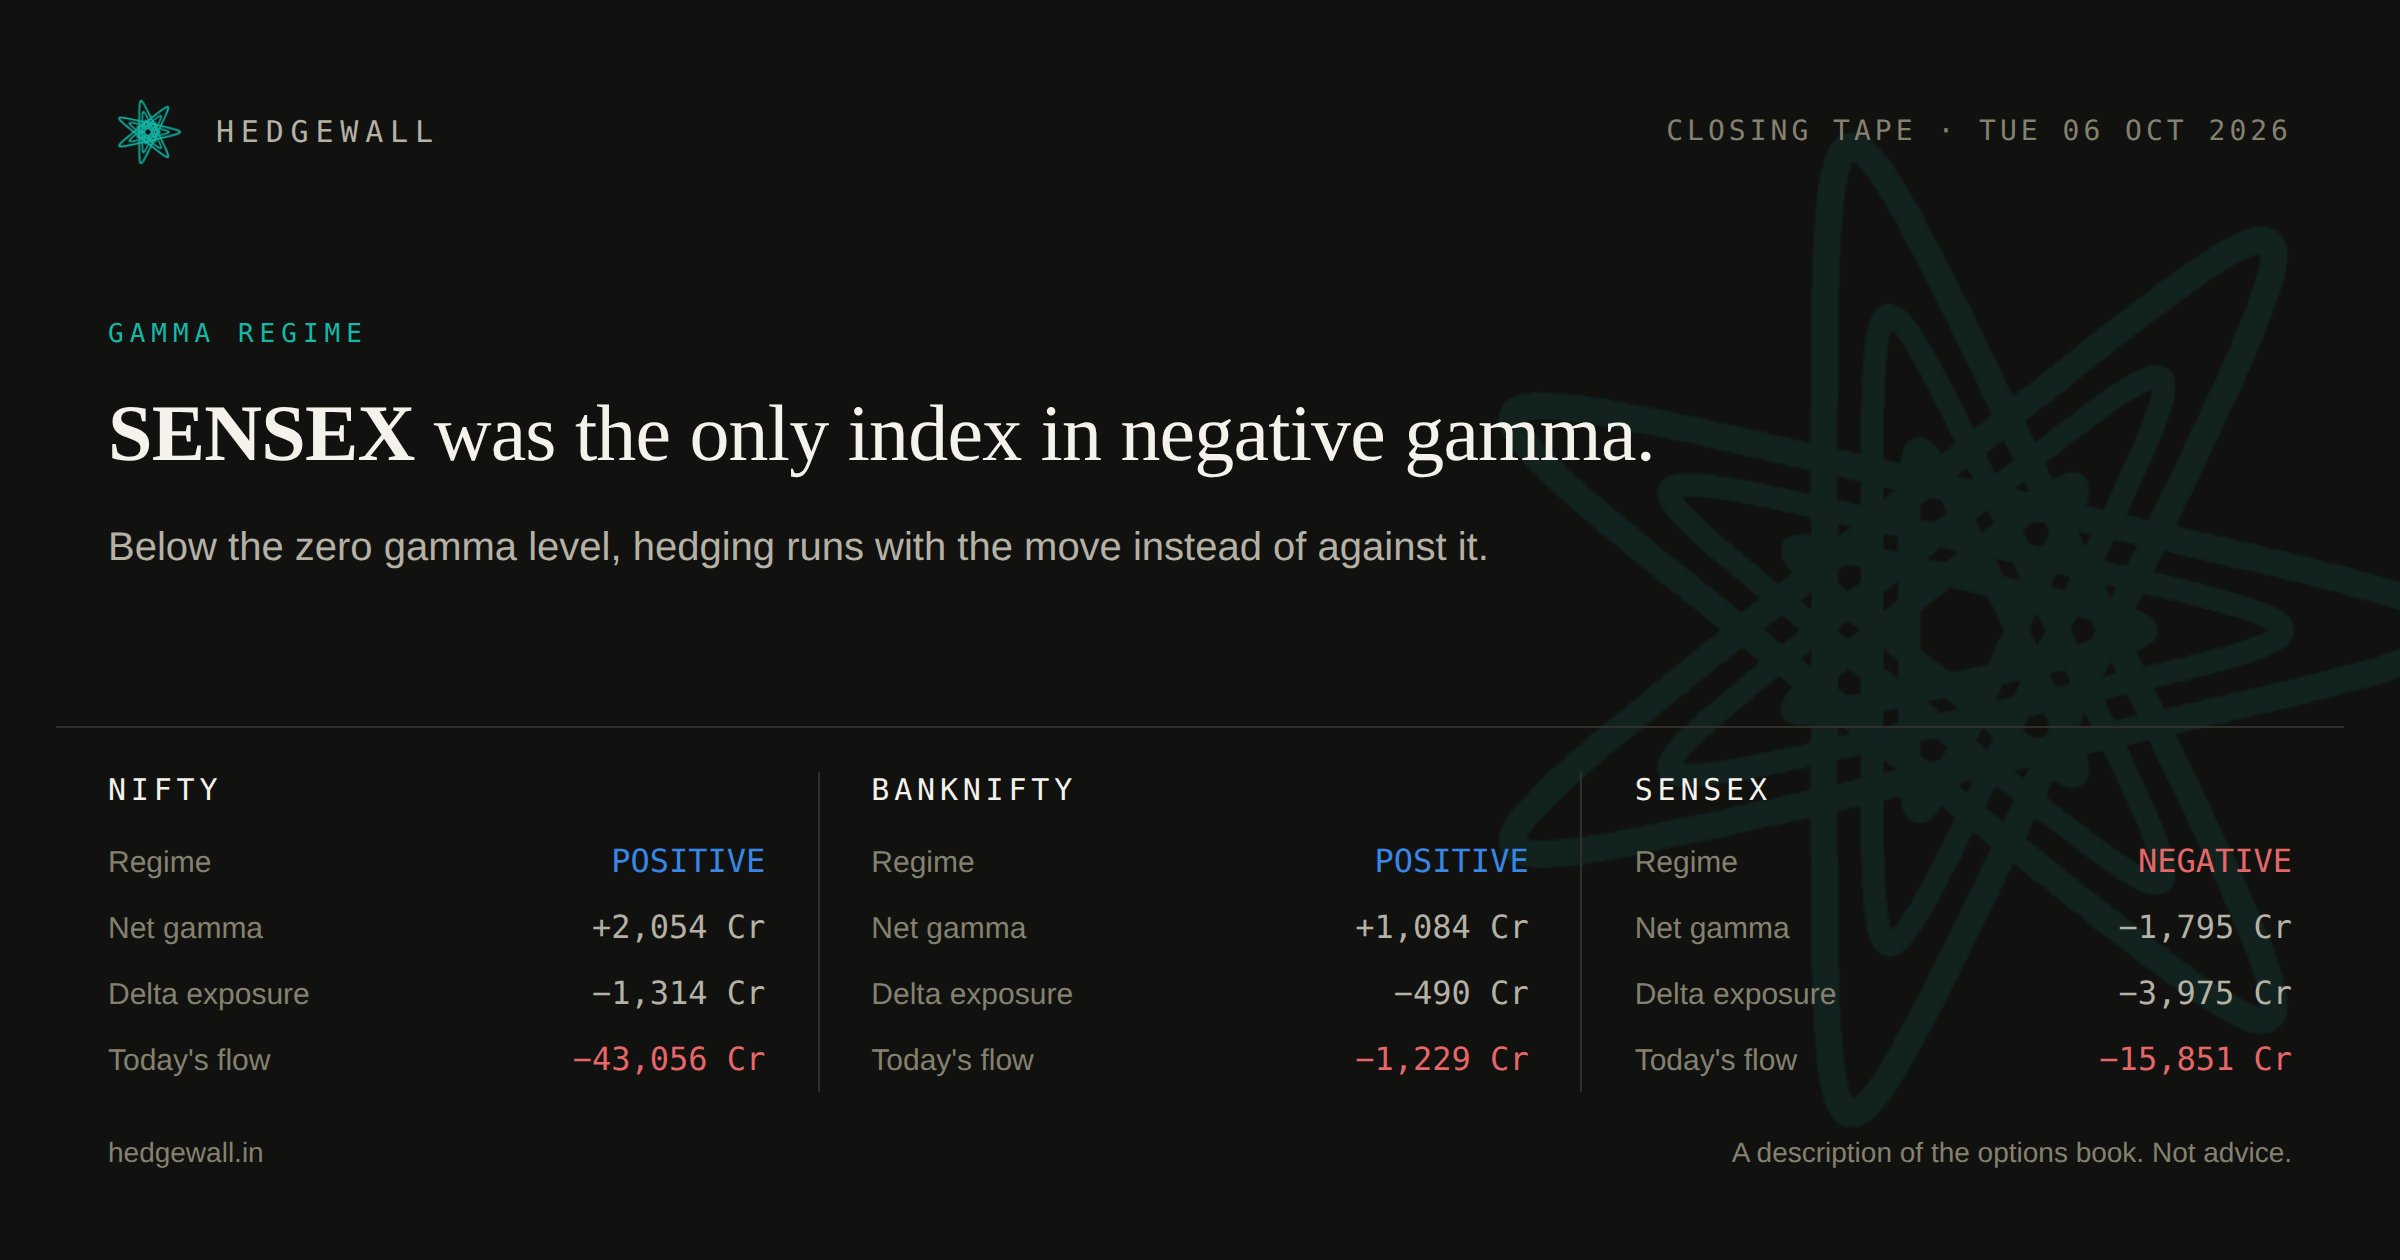
NIFTY closed 0.01 percent over its gamma flip, in a positive-gamma regime.
NIFTY22,776.10+0.856%
positive gamma · expiry day
GEX +2,054 Cr · Delta -1,314 Cr · Flow -43,056 Cr
BANKNIFTY55,128.40+0.419%
positive gamma
GEX +1,084 Cr · Delta -490 Cr · Flow -1,229 Cr
SENSEX73,067.81+0.857%
negative gamma
GEX -1,795 Cr · Delta -3,975 Cr · Flow -15,851 Cr
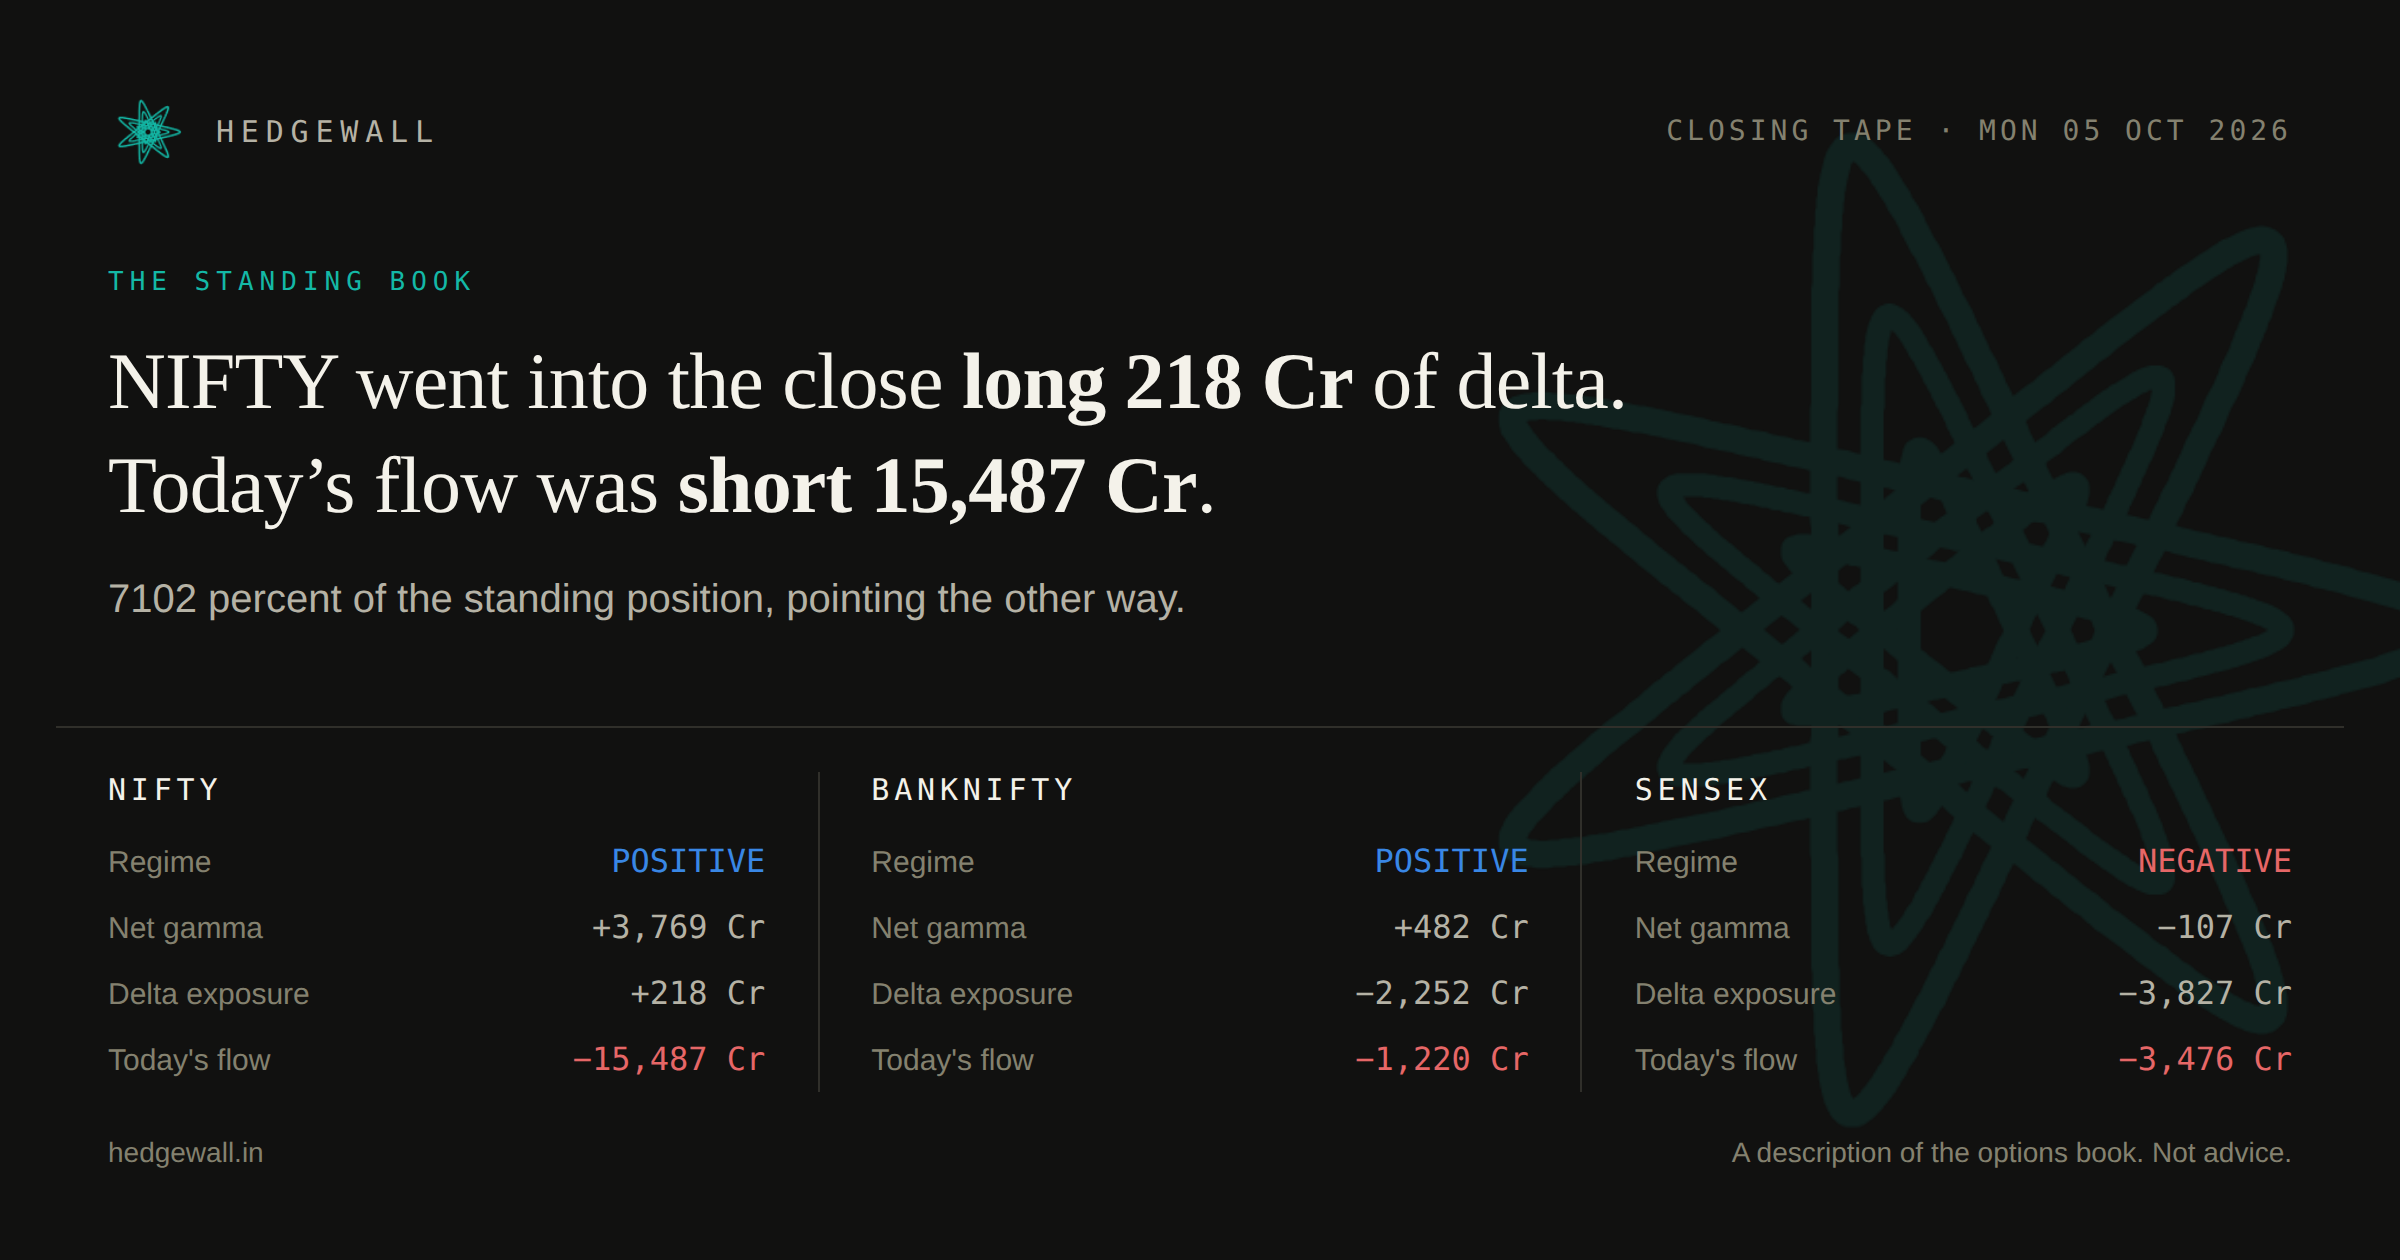
SENSEX closed 0.02 percent under its gamma flip, in a negative-gamma regime.
NIFTY22,555.75+0.061%
positive gamma
GEX +3,769 Cr · Delta +218 Cr · Flow -15,487 Cr
BANKNIFTY54,714.10-0.721%
positive gamma
GEX +482 Cr · Delta -2,252 Cr · Flow -1,220 Cr
SENSEX72,382.47+0.034%
negative gamma
GEX -107 Cr · Delta -3,827 Cr · Flow -3,476 Cr
NIFTY22,421.95-0.546%
BANKNIFTY54,450.75-0.633%
SENSEX71,909.70-0.730%
Gamma, delta and flow: data not clear for this day. The way gamma is measured changed around this date and we cannot tell which side it fell on. Open the tape to see it as it was published.
September 2026
NIFTY22,620.45-0.235%
BANKNIFTY54,633.05+0.418%
SENSEX72,480.29-0.080%
Gamma, delta and flow: data not clear for this day. The way gamma is measured changed around this date and we cannot tell which side it fell on. Open the tape to see it as it was published.
NIFTY22,716.20-0.031%
BANKNIFTY54,259.95-0.100%
SENSEX72,529.07-0.035%
Gamma, delta and flow: data not clear for this day. It was computed with each index's lot size counted twice. Open the tape to see it as it was published.
NIFTY22,780.25-0.932%
BANKNIFTY54,471.65-1.024%
SENSEX72,771.72-0.769%
Gamma, delta and flow: data not clear for this day. It was computed with each index's lot size counted twice. Open the tape to see it as it was published.
NIFTY23,140.50+0.227%
BANKNIFTY55,580.40-0.005%
SENSEX73,895.74+0.251%
Gamma, delta and flow: data not clear for this day. It was computed with each index's lot size counted twice. Open the tape to see it as it was published.
NIFTY23,063.10-0.879%
BANKNIFTY55,438.50-0.719%
SENSEX73,580.54-0.924%
Gamma, delta and flow: data not clear for this day. It was computed with each index's lot size counted twice. Open the tape to see it as it was published.
NIFTY23,446.80+0.352%
BANKNIFTY56,548.90+0.342%
SENSEX74,828.25+0.232%
Gamma, delta and flow: data not clear for this day. It was computed with each index's lot size counted twice. Open the tape to see it as it was published.
NIFTY23,329.00-0.653%
BANKNIFTY56,215.55-0.636%
SENSEX74,529.08-0.584%
Gamma, delta and flow: data not clear for this day. It was computed with each index's lot size counted twice. Open the tape to see it as it was published.
NIFTY23,414.30+0.268%
BANKNIFTY56,470.65+0.301%
SENSEX74,858.99+0.396%
Gamma, delta and flow: data not clear for this day. It was computed with each index's lot size counted twice. Open the tape to see it as it was published.
NIFTY23,346.40+0.005%
BANKNIFTY56,358.70+0.161%
SENSEX74,294.96-0.365%
Gamma, delta and flow: data not clear for this day. It was computed with each index's lot size counted twice. Open the tape to see it as it was published.
NIFTY23,270.60+0.213%
BANKNIFTY56,055.75-0.121%
SENSEX74,314.59+0.093%
Gamma, delta and flow: data not clear for this day. It was computed with each index's lot size counted twice. Open the tape to see it as it was published.
NIFTY23,217.60+0.020%
BANKNIFTY56,292.45+0.342%
SENSEX74,336.45-0.008%
Gamma, delta and flow: data not clear for this day. It was computed with each index's lot size counted twice. Open the tape to see it as it was published.
NIFTY23,118.60-1.701%
BANKNIFTY55,794.75-1.595%
SENSEX74,003.82-1.576%
Gamma, delta and flow: data not clear for this day. It was computed with each index's lot size counted twice. Open the tape to see it as it was published.
NIFTY23,398.10+0.661%
BANKNIFTY56,606.55+1.511%
SENSEX74,781.76+0.831%
Gamma, delta and flow: data not clear for this day. It was computed with each index's lot size counted twice. Open the tape to see it as it was published.
The archive starts on Fri 11 Sep 2026, the day the Closing Tape was first published. For the days before Mon 5 Oct 2026 the price and its change are shown, but not gamma, delta or flow, because those figures were computed differently then and we do not show numbers we cannot stand behind. Each tape keeps the wording of the day it was published, and the definitions behind it have been refined since, so read an old tape as a record of that day.
Hedgewall publishes options market-structure analytics for education and research. Not investment advice. Not a recommendation to buy or sell any security. Markets carry risk.