VIDEO SERIES · 8 EPISODES
Read the Terminal.
Short videos, one per group of panes. Every question below is one traders ask about the option chain, answered with the episode that shows it.
- EPISODES
- 8
- QUESTIONS ANSWERED
- 44
- INDICES
- NIFTY · BANKNIFTY · SENSEX · FINNIFTY · MIDCPNIFTY
Start here · Ep 01 · The Pin Tab, Explained · Watch on YouTube ↗
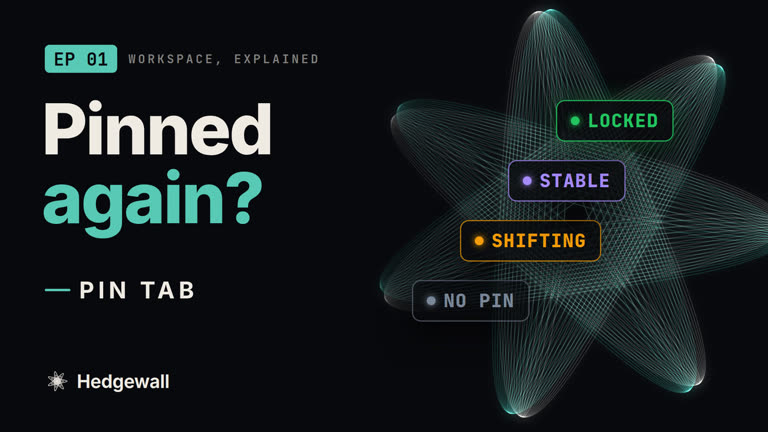
The Pin Tab, Explained
Where the option chain's gamma pressure is concentrated, and how firmly one strike leads.
5 QUESTIONS THIS EPISODE ANSWERS
What is the Pin tab?
It finds the strike where gamma pressure is concentrated. Each strike gets a stack of gamma (in ₹ Cr per 1% move), and the stack is weighed against how far that strike is from the price. The strike that comes out on top is the pin. It is a calculated reading from the option chain, not a prediction.
Answered in Ep 01 · Pin ↗Why isn't the strike with the biggest gamma always the pin?
Size matters, but so does distance from the price. A big stack far from the price counts for less than a smaller stack close to it, so the Pin panes mix both before ranking the strikes.
Answered in Ep 01 · Pin ↗What do No pin, Shifting, Stable and Locked mean?
They are four labels for how firmly one strike leads the race, from No pin (no clear leader) to Locked (the firmest hold). The pane shows the conviction score out of 100 and the band it falls in, so you can see why the label is what it is.
Answered in Ep 01 · Pin ↗What is the time boost?
A multiplier that lets the same gamma count for more as expiry gets closer. The pane shows it beside the days left to expiry, together with σ to expiry, so you can see how much time is adding.
Answered in Ep 01 · Pin ↗Can the Pin tab tell me where NIFTY will close?
No. It describes where the option chain's gamma pressure sits right now. It does not forecast the close, and the pin can move from one strike to another during a session.
Answered in Ep 01 · Pin ↗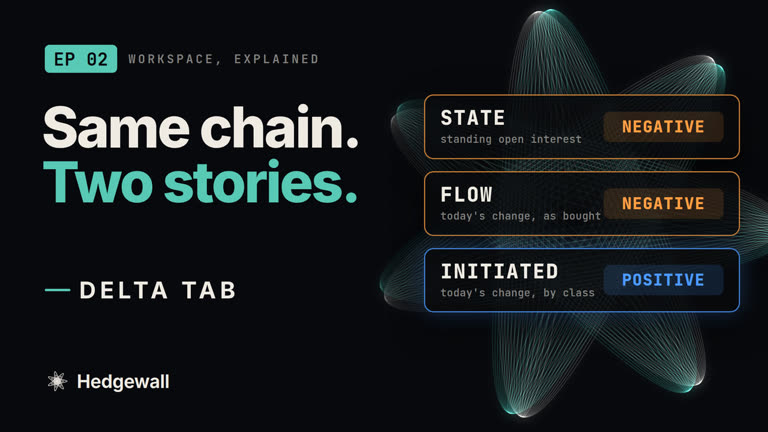
5 QUESTIONS THIS EPISODE ANSWERS
What is delta?
How much an option's price moves for a one-point move in NIFTY. In the recorded session the 24,000 call moved about 0.59 per point and the put about −0.41, which is why calls carry plus delta and puts carry minus.
Answered in Ep 02 · Delta ↗What are State, Flow and Initiated on the Delta tab?
Three readings of the same open interest. State is the whole book, every contract counted as bought. Flow is the change in open interest × delta over the period you pick, since the open or against the previous close, also counted as bought. Initiated is the same change, signed by its class: long buildup, short buildup, short covering or long unwinding.
Answered in Ep 02 · Delta ↗Why can State and Flow be negative while Initiated is positive?
State and Flow count every contract as bought, so puts outweigh calls and the figure carries no direction. Initiated signs the day's change by its class, so it can point the other way. At 1:43 PM on the recorded session State read −₹8,419 Cr: more put delta open than call delta, with no direction behind it.
Answered in Ep 02 · Delta ↗What are long buildup, short buildup, short covering and long unwinding?
Four ways open interest and an option's implied volatility can move together, the volatility read against the whole chain's so the index's move and time passing do not decide it. Open interest up with volatility up is long buildup; up with volatility down is short buildup; down with volatility up is short covering; down with volatility down is long unwinding.
Answered in Ep 02 · Delta ↗Does the Delta tab show who is buying or selling?
No. The readings are calculated from option-chain open interest and price changes. They are calculated values, not observed trades, and they do not identify who holds any position.
Answered in Ep 02 · Delta ↗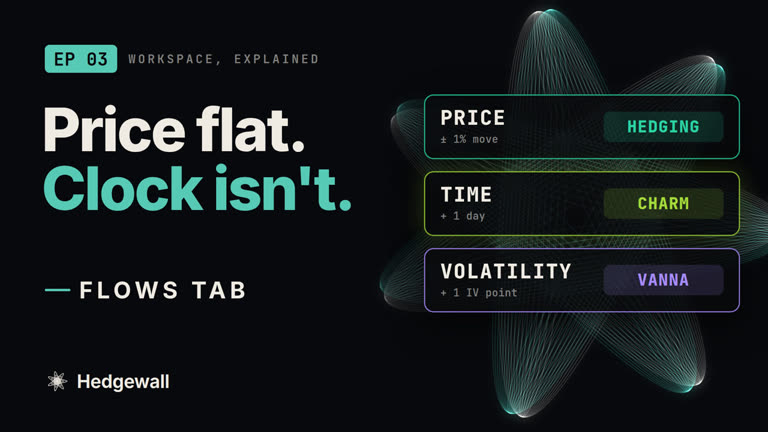
5 QUESTIONS THIS EPISODE ANSWERS
What moves an option's price when NIFTY barely moves?
Three things: price, time and volatility. The Flows panes show what each one is doing, strike by strike.
Answered in Ep 03 · Flows ↗What is charm?
What one calendar day does to delta. It is calculated by moving time forward one calendar day and re-reading delta. At 1:43 PM on the recorded session the book's net charm was −₹1,130 Cr of delta over one calendar day, with NIFTY standing still.
Answered in Ep 03 · Flows ↗What is vanna?
What a one-point rise in implied volatility does to delta. It is calculated by moving IV up one point and re-reading delta. At 1:43 PM on the recorded session it was +₹1,304 Cr of delta per +1 IV point.
Answered in Ep 03 · Flows ↗What is the hedge ladder?
A table of what a move in NIFTY could mean in contracts, at ±0.5%, ±1% and ±2%. For each move it shows the index level, the contracts and the ₹ Cr notional. It is a calculation at today's gamma, not a forecast.
Answered in Ep 03 · Flows ↗Why is SENSEX's charm so large on some days?
On its expiry day time does almost all the work. With less than a day left, charm is the change in delta from now to the expiry payoff, over the hours that remain, not a full day's change. On the recorded session SENSEX expired that afternoon: at 1:43 PM, with 1.8 hours left, its net charm to the payoff was −₹1,025 Cr of delta, about as much as NIFTY's −₹1,130 Cr over a full calendar day.
Answered in Ep 03 · Flows ↗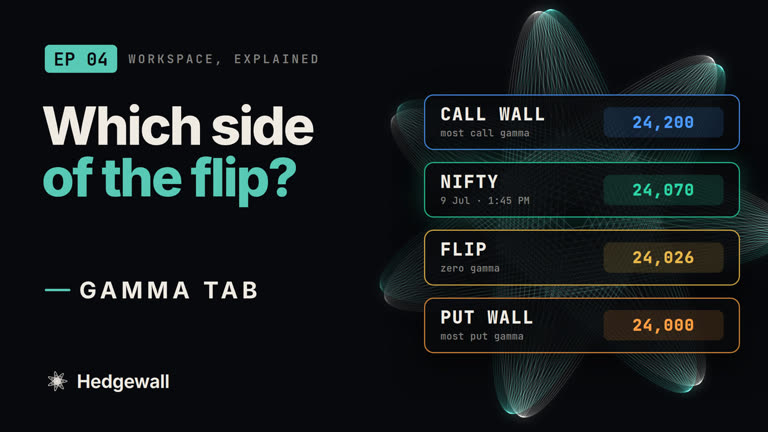
5 QUESTIONS THIS EPISODE ANSWERS
What is gamma?
The speed of delta: how fast an option's delta changes as the price moves. The 24,100 call on the recorded session had a delta of about 0.47 and a gamma of about 0.0012 per point.
Answered in Ep 04 · Gamma ↗What is net gamma exposure?
Gamma × open interest, scaled to ₹ Cr per 1% move, added up across every strike. Calls count plus and puts count minus. At 1:43 PM on the recorded session it came to about +₹4,600 Cr.
Answered in Ep 04 · Gamma ↗What does positive or negative gamma mean for the market?
In a positive-gamma regime, potential hedging pressure leans against the move. In a negative-gamma regime, it leans with the move. It describes how positioning is set up now. It is not a forecast of where the index goes.
Answered in Ep 04 · Gamma ↗What is the gamma flip (zero gamma level)?
The price at which net gamma crosses zero, where the regime switches. At 1:43 PM on the recorded session it was 24,025, 45 points below the price.
Answered in Ep 04 · Gamma ↗What are the call wall and the put wall?
The strike with the most gamma on each side of the price. On the recorded session the call wall was 24,200 and the put wall 24,000.
Answered in Ep 04 · Gamma ↗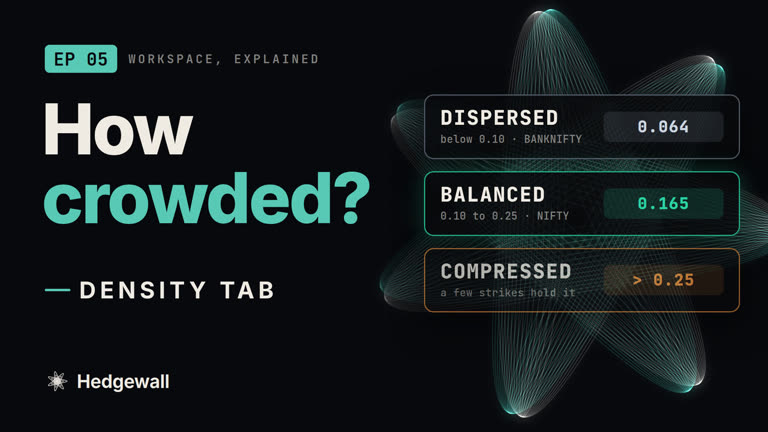
5 QUESTIONS THIS EPISODE ANSWERS
How crowded is the gamma on the chain?
The Density panes answer it with one number, HHI. Take each strike's share of all the gamma, square every share and add them up. The more the gamma sits on a few strikes, the higher the number.
Answered in Ep 05 · Gamma Density ↗What do dispersed, balanced and compressed mean?
Three bands of HHI: dispersed is below 0.10, balanced is 0.10 to 0.25 and compressed is above 0.25.
Answered in Ep 05 · Gamma Density ↗Is the biggest open interest strike the same as the biggest gamma strike?
Not necessarily. Finding the biggest open interest and asking how much of all the gamma sits on one strike are different questions.
Answered in Ep 05 · Gamma Density ↗What does HHI look like on different indices?
It varies by index and by session. Each index is read on its own book, so compare an index with itself over time before comparing one index with another.
Answered in Ep 05 · Gamma Density ↗Does HHI change during the day?
Yes. It is redrawn with each reading, so it moves through the session.
Answered in Ep 05 · Gamma Density ↗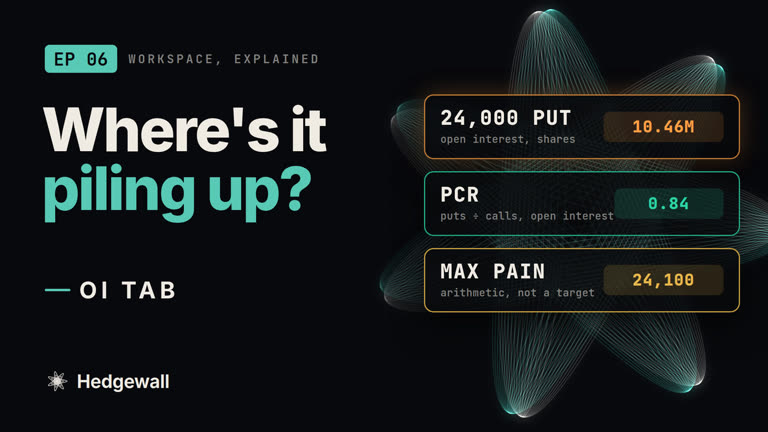
5 QUESTIONS THIS EPISODE ANSWERS
What is open interest?
The positions that are still open, which is different from trading volume. It is the count of what has been opened and not yet closed.
Answered in Ep 06 · OI ↗What is the change in open interest (ΔOI) since the open?
How much each strike's open interest has grown or shrunk since the session began. One number can't tell you when open interest got there or whether it is still growing; the change does.
Answered in Ep 06 · OI ↗What are PCR and the PCR of the change?
PCR is the put-call ratio on open interest (0.84 at 1:43 PM on the recorded session). The PCR of the change applies the same ratio to the day's change only, so the two can tell different stories.
Answered in Ep 06 · OI ↗Is max pain a magnet or a target?
No. Max pain is arithmetic on open interest, the strike where the totals work out to a particular figure. It is not a prediction of where the price will go. On the recorded chain it was 24,100.
Answered in Ep 06 · OI ↗The IV Tab, Explained
What the chain is priced for: ATM IV, the straddle, the smile and the term structure.
5 QUESTIONS THIS EPISODE ANSWERS
What is implied volatility (IV)?
How much movement the option prices are built for, read from the chain today and quoted as an annual percentage.
Answered in Ep 07 · IV ↗What is the ATM straddle and why does it matter?
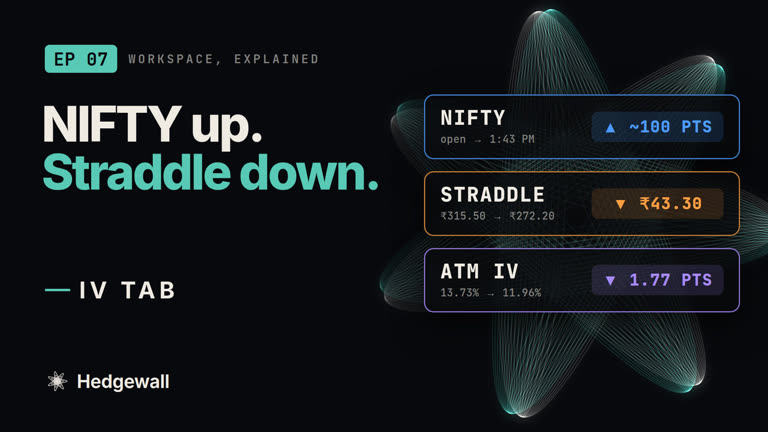
The at-the-money call plus the at-the-money put: the price of the move. On the recorded session, at 24,050, the ₹148.80 call and the ₹123.40 put made a ₹272.20 straddle.
Answered in Ep 07 · IV ↗Why can the straddle fall when NIFTY goes up?
Because the premium follows IV as well as price. From the open to 1:43 PM on the recorded session NIFTY rose about 100 points, yet ATM IV slid from 13.73% to 11.96% and the straddle fell from ₹315.50 to ₹272.20.
Answered in Ep 07 · IV ↗What is the difference between implied and realized volatility?
Implied is what the chain prices today. Realized is what the index actually did over a lookback of past sessions. The Volatility panes let you read the two side by side.
Answered in Ep 07 · IV ↗What are the smile and the term structure?
The smile is IV plotted across strikes at one expiry. The term structure is ATM IV across expiries. On Hedgewall, call IV and put IV at one strike are the same number by construction, so the smile is read as the shape across strikes.
Answered in Ep 07 · IV ↗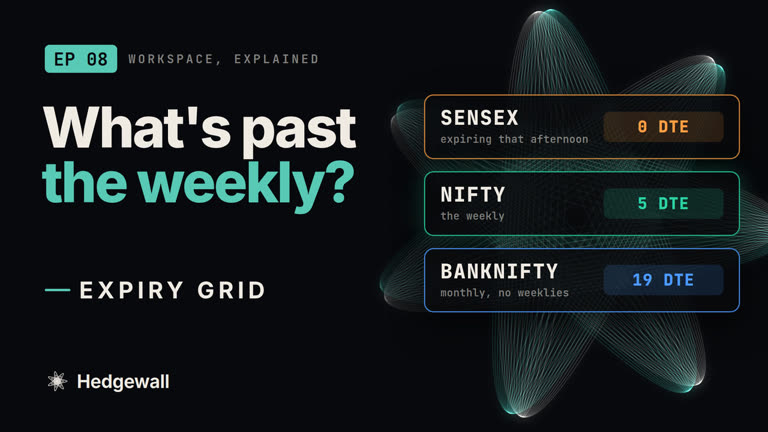
5 QUESTIONS THIS EPISODE ANSWERS
What sits beyond the weekly expiry?
Open interest also sits in next week's series, the monthly and the months after it, all open at the same time. The Expiry grid puts every strike of every expiry side by side.
Answered in Ep 08 · Expiry grid ↗How do I read the Expiry grid?
Columns are expiries and rows are strikes, with the days to expiry on top. A measure switch changes what the cells show: GEX, DEX, VEX, CEX, open interest or volume. The dashed row sits nearest the price.
Answered in Ep 08 · Expiry grid ↗Why do NIFTY, BANKNIFTY and SENSEX look so different on the grid?
Each runs its own expiry calendar. On the recorded session SENSEX expired that afternoon (0DTE), NIFTY's weekly had 5 days left, and BANKNIFTY has no weeklies, so its front expiry was the monthly.
Answered in Ep 08 · Expiry grid ↗What does an expiry day look like on the grid?
Time does almost all the work. SENSEX's net charm at 1:43 PM on its expiry day was −₹1,025 Cr of delta on the recorded session: the change from then to the expiry payoff over the 1.8 hours that remained, about as much as NIFTY's −₹1,130 Cr over a full calendar day.
Answered in Ep 08 · Expiry grid ↗BEFORE YOU START
About Hedgewall
Does Hedgewall predict price or give trade advice?
No. Hedgewall shows options positioning calculated from the option chain. It does not forecast price, give entries or exits, or recommend any trade.
Does Hedgewall show who holds a position?
No. The figures are calculated values, not observed trades, and they do not identify who holds any position.
Which indices does Hedgewall cover?
NIFTY, BANKNIFTY, SENSEX, FINNIFTY and MIDCPNIFTY.
How do I get access to Hedgewall?
Start a 7-day free trial, no card; the code is emailed to you.
Now read it on today's chain.
Start a 7-day free trial, no card; the code is emailed to you.
Example numbers in the answers are from the recorded 9 July 2026 session and are labelled as such. They are not live.
Hedgewall publishes options market-structure analytics for education and research. Not investment advice. Not a recommendation to buy or sell any security. Markets carry risk.